Reporting is a key feature of any survey platform, helping turn your data into insights that can drive action. When you create a survey in Snap XMP, there are 4 one-click reports to help you better understand your data.
- The Questionnaire report generates a top-line summary report showing the counts and percentages of responses in the questionnaire layout.
- The Summary report generates a chart, table or list for every question
- The Summary Tables report tabulates responses to all questions.
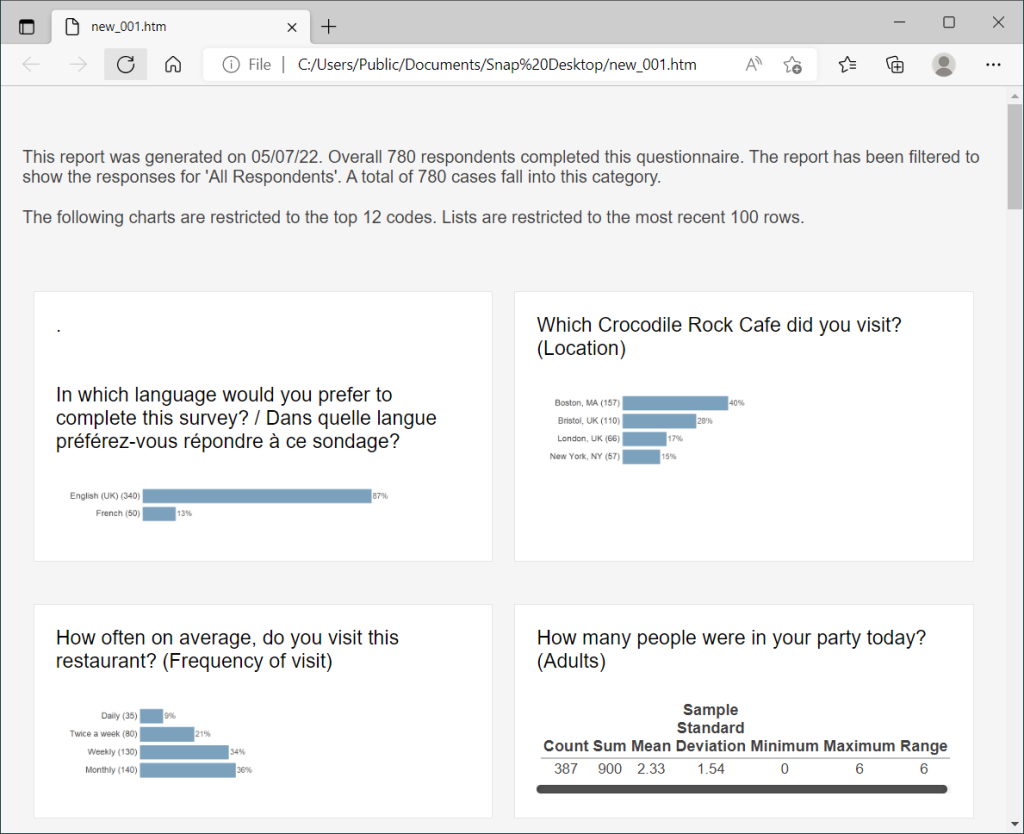
- The Summary Dashboard report is used to generate an HTML summary report with images of each chart, table or list for each question and displayed in a double column format.