The standard reports
Four standard reports are created for each new survey. (Surveys created prior to build 12.10 contain three standard reports)
- The Questionnaire report generates a top-line summary report showing the counts and percentages of responses in the questionnaire layout.
- The Summary report generates a chart, table or list for every question
- The Summary Tables report tabulates responses to all questions.
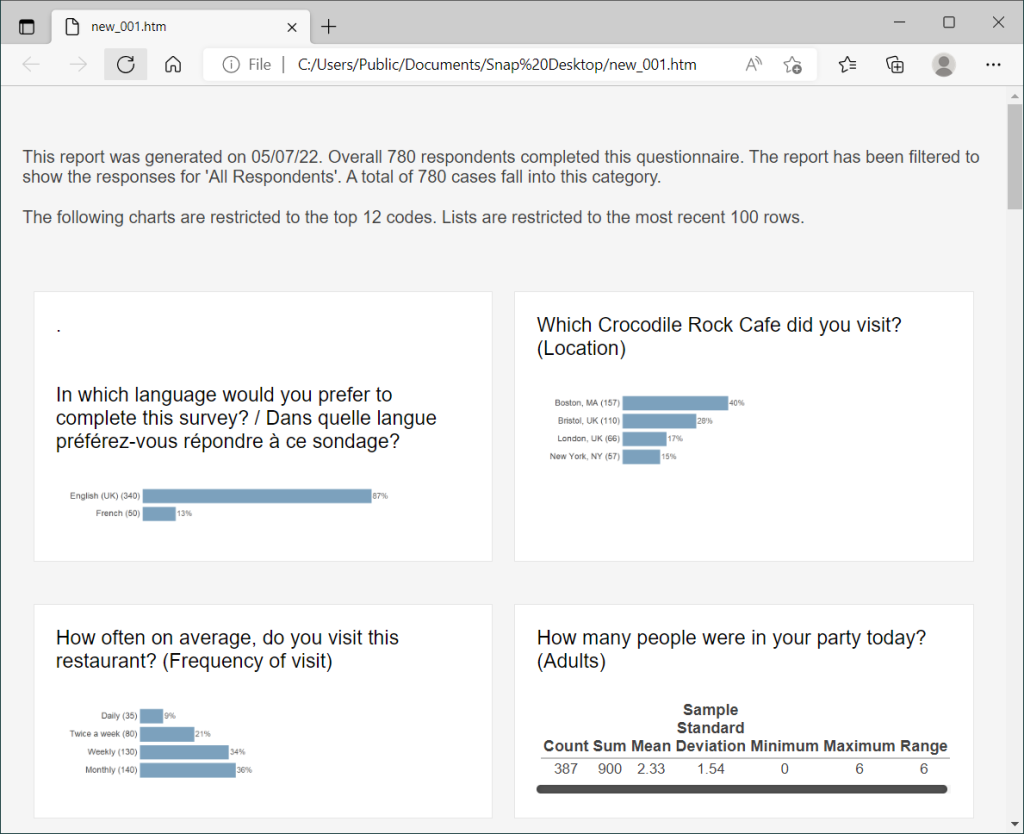
- The Summary Dashboard report is used to generate an HTML summary report with images of each chart, table or list for each question and displayed in a double column format. (This report is available for surveys created using build 12.10 and after.)
You can find these in the Reports window.
Preview and executing the standard report
- Click Reports
 on the toolbar to open the Reports window.
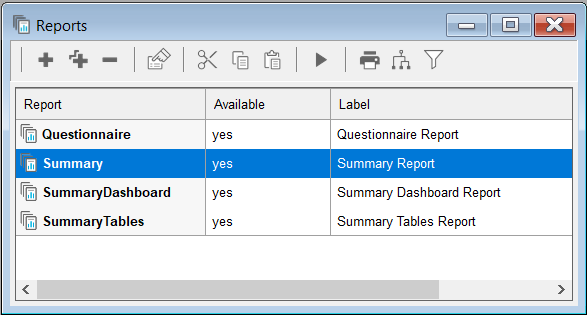
- Select the report required in the Reports window.
- Click the Execute
 button on the Reports window toolbar to run the report. This opens the Report Execution dialog showing the report selected in the window title.
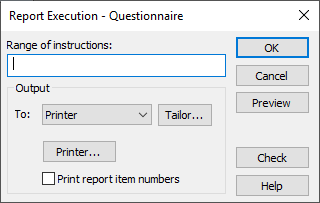
- Click Preview to preview your report on screen.
- Close the preview window.
- Click the Execute
 button on the Reports window toolbar again to open the Report Execution dialog.
 - In To, select the output type: Printer to print the report or Export to export to a file. If Print is selected the Printer button allows you to select a different printer. If Export is selected you can select the file type.
- Tailor allows you to set the page details for a printed report or file details for an exported file.
- Click OK to run your report.
Executing the Summary Dashboard report
- Click Reports
 on the toolbar to open the Reports window.
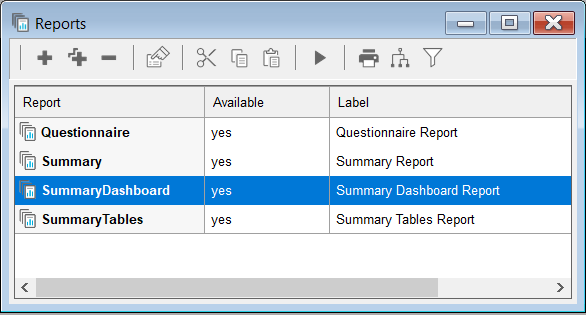
- Select the Summary Dashboard report in the Reports window.
- Click the Execute
 button on the Reports window toolbar to run the report. This opens the Report Execution dialog showing the report selected in the window title.
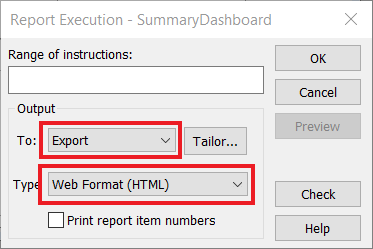
- In To, select Export as the output type. This exports the report to a file.
- In Type, select the file type as Web Format (HTML).
- Tailor allows you to set the file details for the exported report
- Click OK to export the report. The report is shown in two columns. Each chart or table image can be saved as an image file to be used elsewhere. (This may depend on the web browser used.)
Changing the standard Questionnaire report
You can change the instructions and layout of a questionnaire report to match a specific edition. You can also choose to show hidden questions.
- Click Reports
 on the Snap toolbar to open the Reports window.
 - In the Reports window, double-click the Questionnaire report to open it. It consists of two instructions, a Tailor Analysis and a Questionnaire Report instruction.
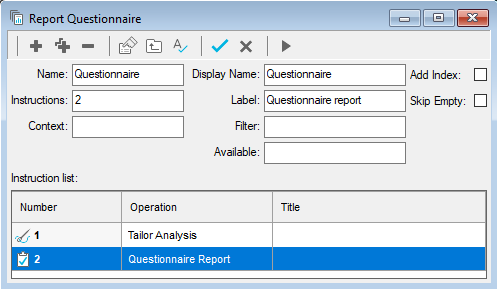
- Double-click the Questionnaire Report instruction to open it.
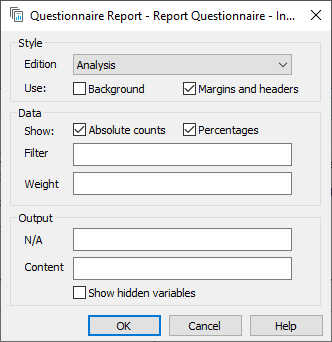
- In the Edition box select the edition you want as your report layout.
- Select the Background check box to include the background image or colors for that edition.
- Select the Margins and headers check box if you want to use the margins and headers for that edition.
- Specify a Filter to restrict the data used in the report.
- In the N/A box enter a logical expression that refers to a table cell or context value and for which the report is not applicable. You can use this to test if an analysis is empty. For example, if you have an analysis of visitors AN1, you can use the condition AN1 empty. This would only build the report if there were visitors.
- In the Content box enter the Variables that you wish to include. If the field is left blank, all the question variables will be included. You can include paradata and derived variables in the list.
- Click OK to save your changes.
- Click Execute
 on the Report window to run the report.
Changing the standard Summary report
You can change the content of a Summary report.
- Click Reports
 on the Snap toolbar to open the Reports window.
 - In the Reports window, double-click on the Summary report to open it. It consists of five instructions. There are three instructions laying the report out, an Information instruction giving the title and a brief description and a Summary Report instruction.
- Double-click the Information instruction to open it. You can change the default description.
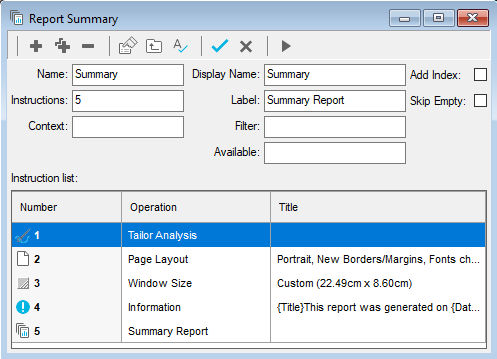
- Double-click the Summary Report instruction to open it.
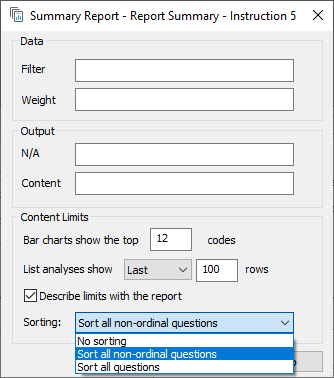
- Specify a Filter to restrict the data used in the report.
- In the N/A box enter a logical expression that refers to a table cell or context value and for which the report is not applicable. You can use this to test if an analysis is empty. For example, if you have an analysis of visitors AN1, you can use the condition AN1 empty. This would only build the report if there were visitors.
- In the Content box enter the variables that you wish to include. If the field is left blank, all the question variables will be included. You can include paradata and derived variables in the list.
- Click OK to save your changes.
- Click Execute
 on the Report window to run the report.
Changing the standard Summary Tables report
You can change the content of a Summary Tables report.
- Click Reports
 on the Snap toolbar to open the Reports window.
 - In the Reports window, double-click on the SummaryTables report to open it. It consists of four instructions. There are two instructions laying the report out, an Information instruction giving the title and a brief description and a SummaryTables report instruction.
- Double-click the Information instruction to open it. You can change the default description.
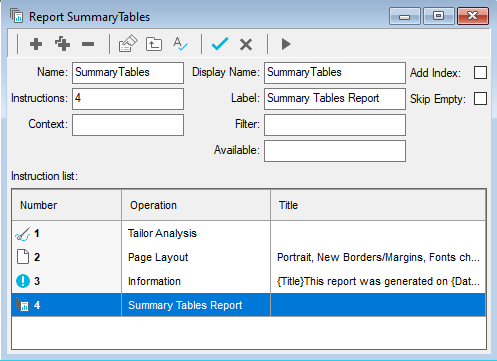
- Double-click the Summary Tables Report instruction to open it.
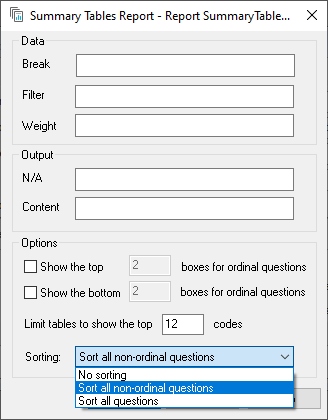
- Specify a Filter to restrict the data used in the report.
- In the N/A box enter a logical expression that refers to a table cell or context value and for which the report is not applicable. You can use this to test if an analysis is empty. For example, if you have an analysis of visitors AN1, you can use the condition AN1 empty. This would only build the report if there were visitors.
- In the Content box enter the variables that you wish to include. If the field is left blank, all the question variables will be included. You can include paradata and derived variables in the list.
- In the Options section, specify whether to show the top and bottom results and the sorting.
- Click OK to save your changes.
- Click Execute
 on the Report window to run the report.
Changing the standard Summary Dashboard report
The Summary Dashboard report is based on the Summary report and includes a Summary Report instruction. This can be changed in the same way as described for the Summary report.