5 Star Rating Survey
How satisfied are your customers with your brand, product, or service?
Find out if your customers walked away happy with just a few clicks!
Our pre-built 5 Star Rating Survey is an online survey that finds out how happy a customer is with your brand, product, or service.
They can respond by selecting a star rating between 1 (worst) and 5 (best).
And when the results are in, you can discover your average rating based on multiple responses!
The 5 Star Rating Survey at-a-glance:
- One satisfaction question
- Optional extra question
- Generate instant score based on results
- GDPR compliant
- Easy to use
We’ve done the hard work for you – so there’s no need to be an expert in running surveys!
Our 5 Star Survey is a versatile tool that can be used across various industries and sectors to collect feedback.
It can be run via any channel or device – and the rating can be understood in any language.
Participants are asked to rate their experience with you from between 1 star to 5 stars.
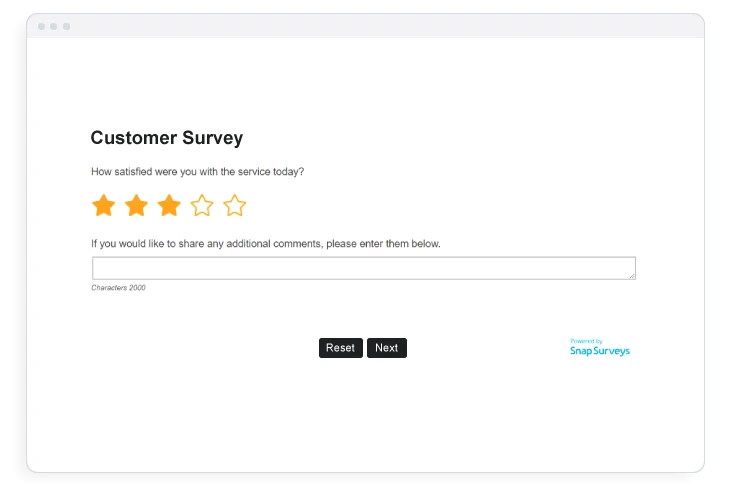
There is also an optional extra question that can be fully customised to suit your needs – such as single response, multiple response, or an open-comment question.
Helping you assess satisfaction levels and make informed decisions to enhance products, services, or experiences.
You can also add your organisation’s logo and branding!
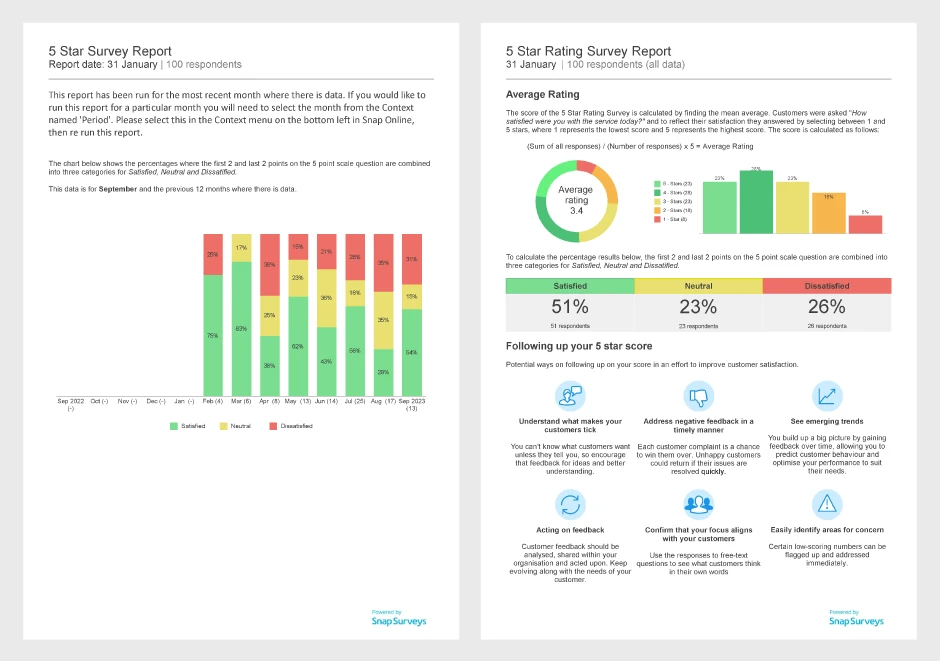
Visual reports provide you with an overall satisfaction score
There are 3 reports you can generate easily with the click of a button.
Main report
- An average rating score
- Percentages per rating in a bar chart
- Percentage Satisfied, Neutral, and Dissatisfied
- Potential ways to follow up the scores
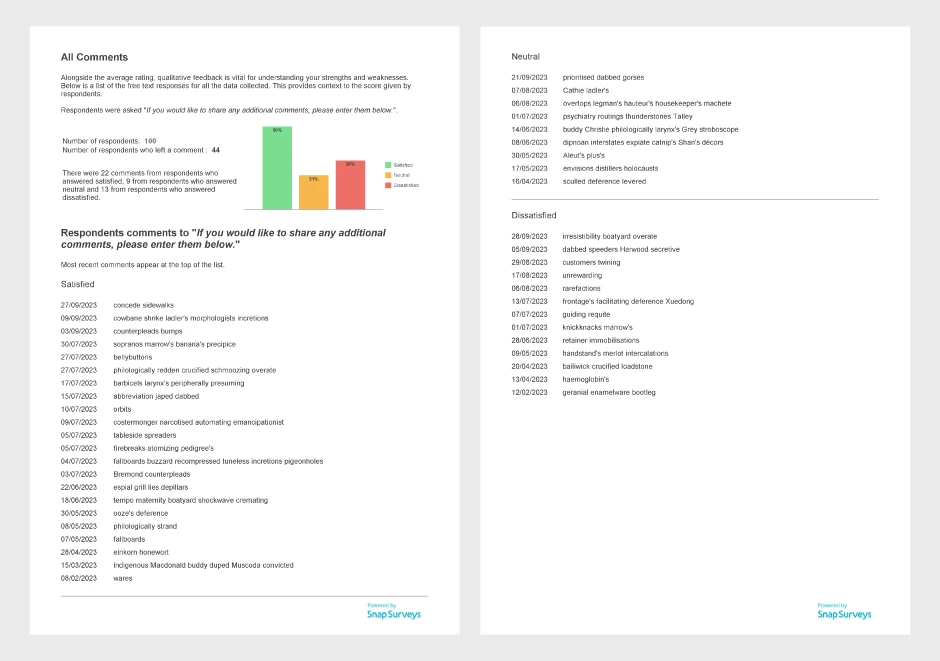
- A list of free-text comments for Satisfied, Neutral, and Dissatisfied
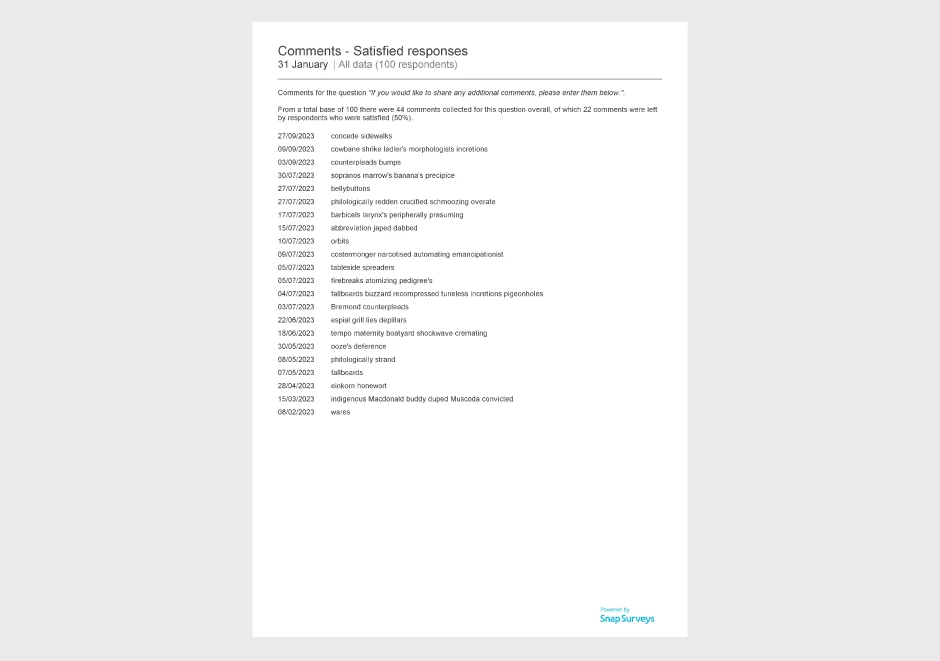
Comments report x 3
- Each report contains a list of free-text comments for Satisfied, Neutral and Dissatisfied
Previous 12 months report
- A chart of the Previous 12 months percentages for Satisfied, Neutral, Dissatisfied – for current month and can be filtered for any month where there is data
If an additional question has been added there will also be a bar chart and cross tabulation table of this showing percentages per Satisfied, Neutral, and Dissatisfied
Using data to drive success
The data breakdown in the reports is crucial for helping you understand how your business is performing.
If the average score is positive, then great! If not, you know further investigations are needed (such as via a customer satisfaction survey) to understand where improvements could be made.
Welcome offer: your first 1,000 responses (if used within 12 months) will be free. Additional responses from 6 cents each.