Survey Reporting
Snap XMP offers a comprehensive suite of survey reporting tools designed to transform data into actionable insights.
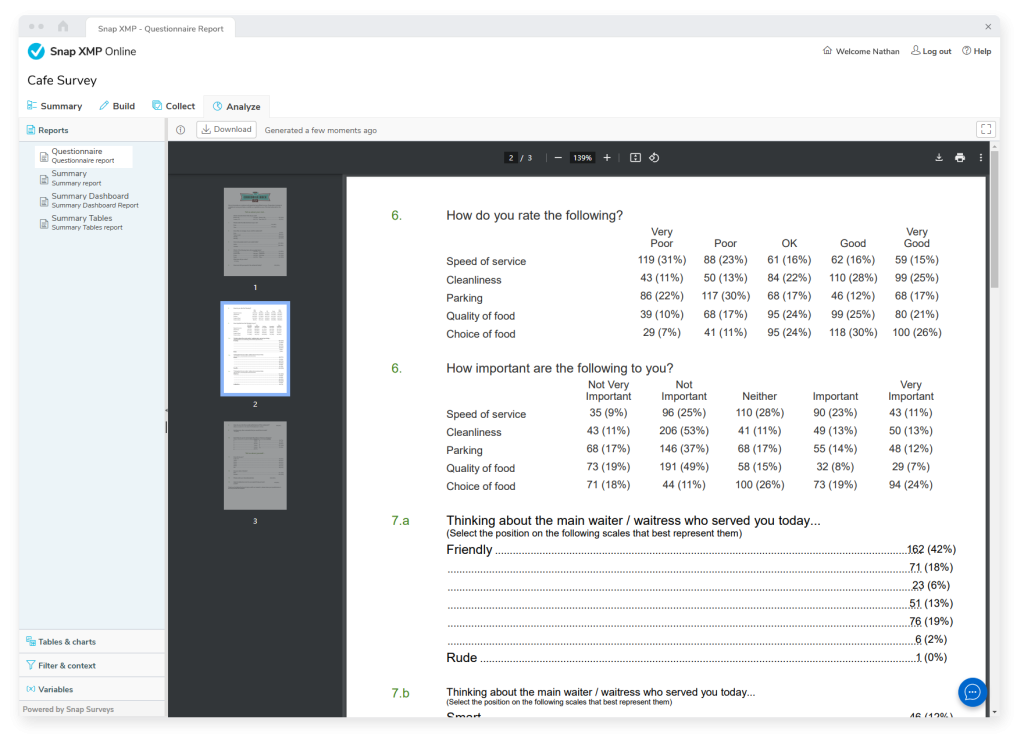
Questionnaire Reports
Kickstart your analysis with a clear and concise Questionnaire Report, providing a high-level overview of your survey results:
- Quickly understand the responses to each question with numerical summaries. For example: “85% of respondents said your service was good”.
- Easily apply filters to focus on specific audience groups, refining insights without including irrelevant data like non-respondents.
- Seamlessly integrate the Questionnaire Report into a detailed Smart Report for deeper analysis.
Streamline your reporting process and gain meaningful insights with precision and flexibility.
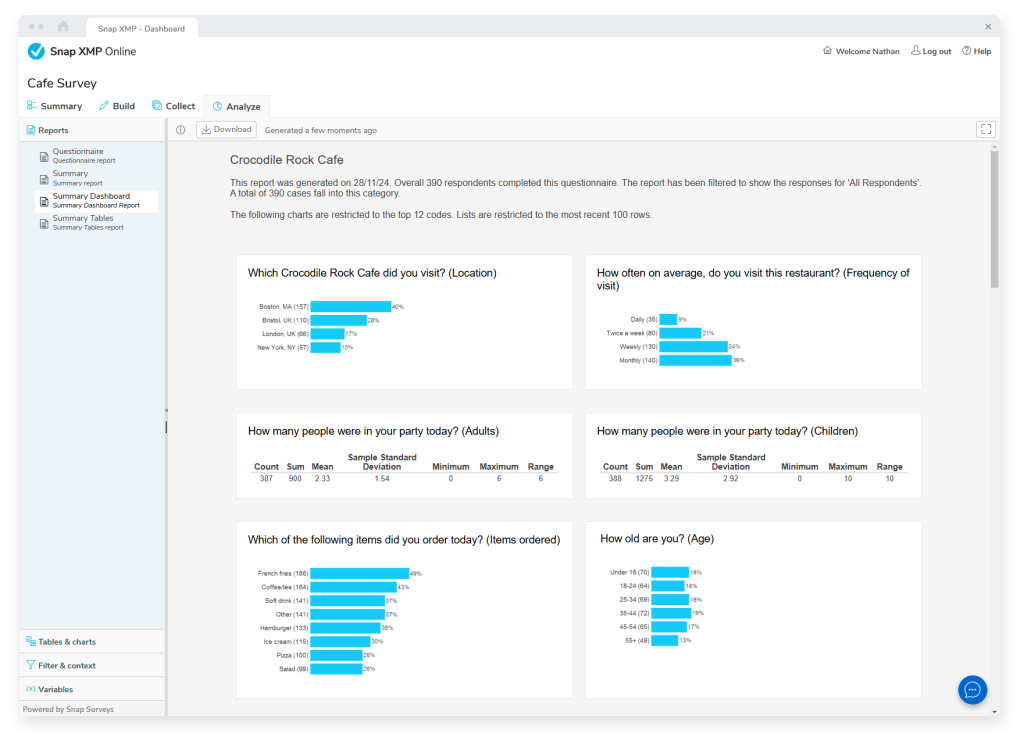
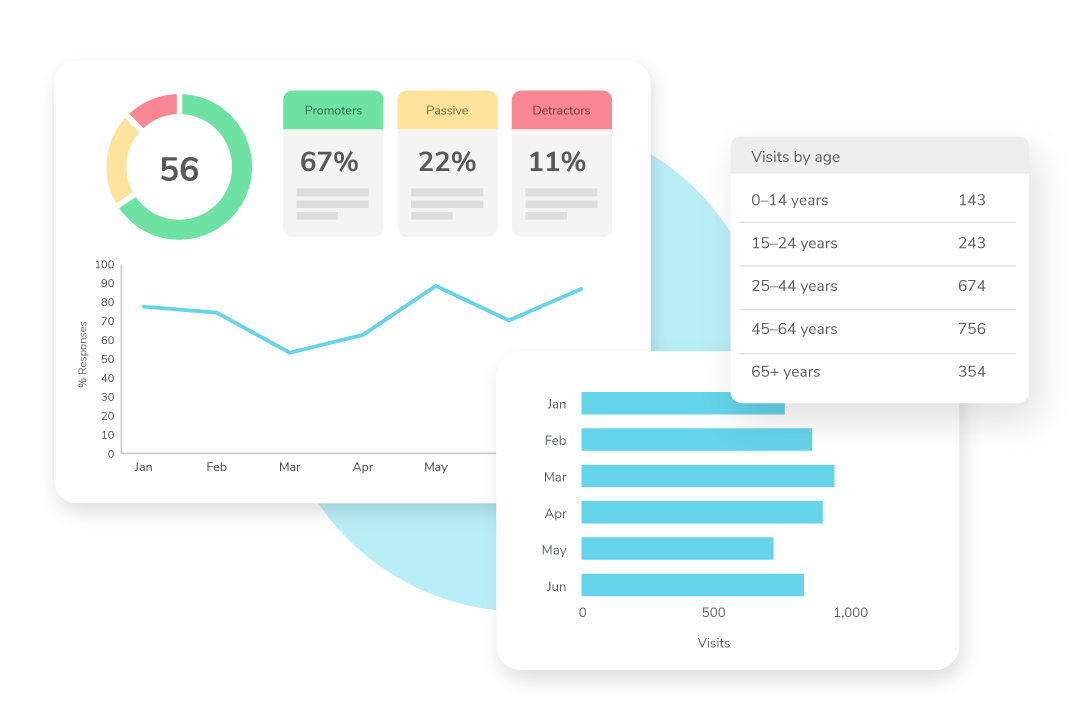
Summaries: Reports, Dashboards, Tables
Gain clear and flexible insights with Summary Reports, Dashboards and Tables, designed for detailed analysis and impactful presentation:
- Display results as bar charts, tables, or comment lists for each survey question.
- Add commentary, date stamps, and sample size details for extra context.
- Customize reports with branding elements like logos, fonts, and images.
- Use filters to focus on specific groups, with options to exclude non-respondents.
These tools can be seamlessly included in a Smart Report for comprehensive analysis.
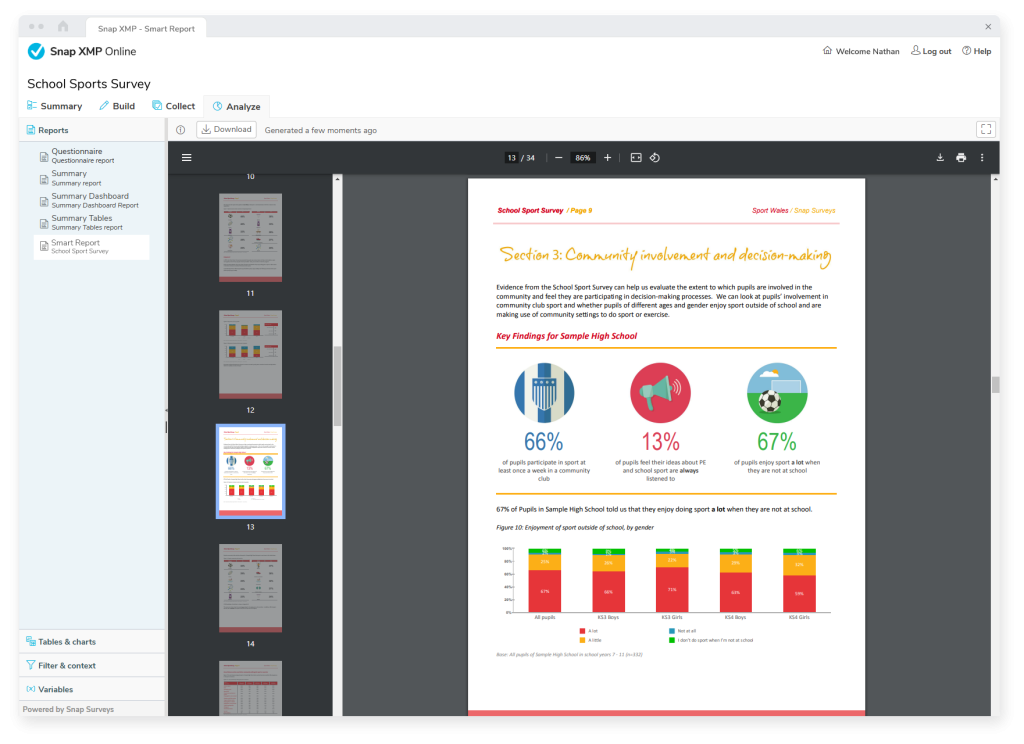
Smart Reports
Smart Reports offer sophisticated analysis, letting you compare and benchmark things like multiple departments or regions.
Set up once and run multiple times with ease, saving you time and money. They can also provide recommendations for improvements where appropriate.