Benefit fully from the time and effort you have invested in collecting replies. Snap’s powerful analysis tools enable you to examine, and thoroughly explore your data, then present results clearly and effectively.
Present Results
Choose from a range of analysis types to present your results, with the option to add images and edit elements such as color or font to reflect branding.
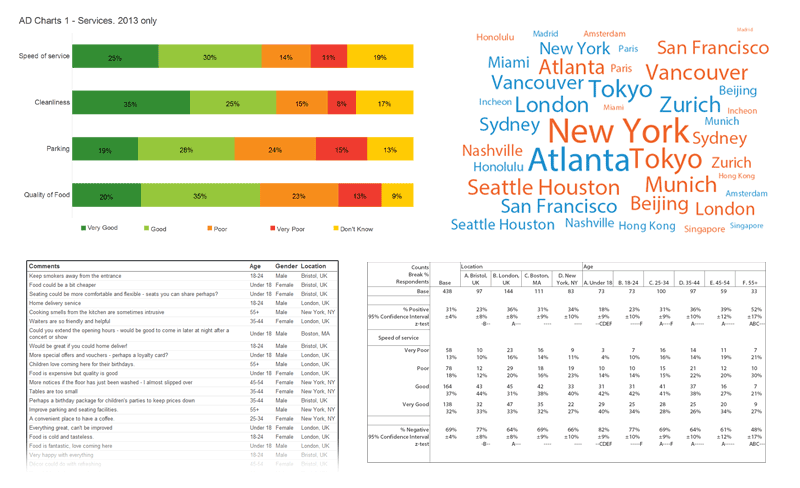
Tables – results can be cross-analyzed by demographics and expressed as percentages and/or counts. Statistical tests can also be added.
Charts – choose from a wide range of chart styles, including bar, pie, bubble and line.
Lists – comments and open-ended replies can be shown alongside any other data, such as age or gender.
Maps – Overlay an image, such as a regional map, with survey results. An effective visual alternative to a standard table.
WordClouds – a unique method of presenting textual data. Frequently occurring words are displayed with greater prominence or specific colors.
All analyses are rebuilt with current data, so you can get a headstart on your analysis even before all the results are collected. You can also:
- Copy and paste analyses and data into Word or Excel
- Include analyses in an automated report
Explore your data
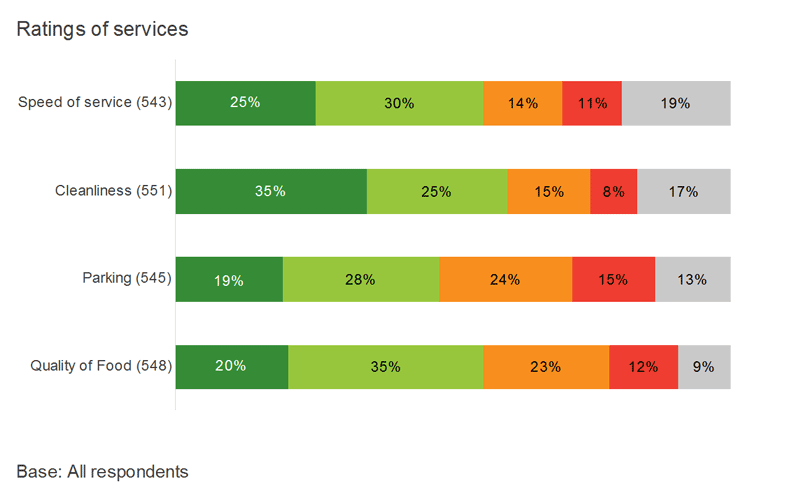
Use Snap’s Analysis tools to refine and simplify your results, leaving only the important detail. This example shows how replies to grid questions can be summarized:
1. Simple bar charts like this give you a useful overview, but with Snap you can dig deeper.
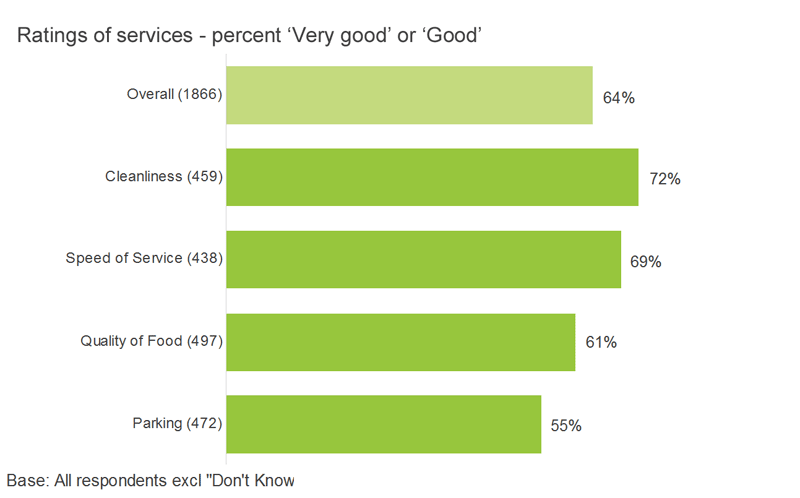
2. Using derived variables you can combine categories, showing only the percent good and very good, and add a new overall category to summarize all the service areas.
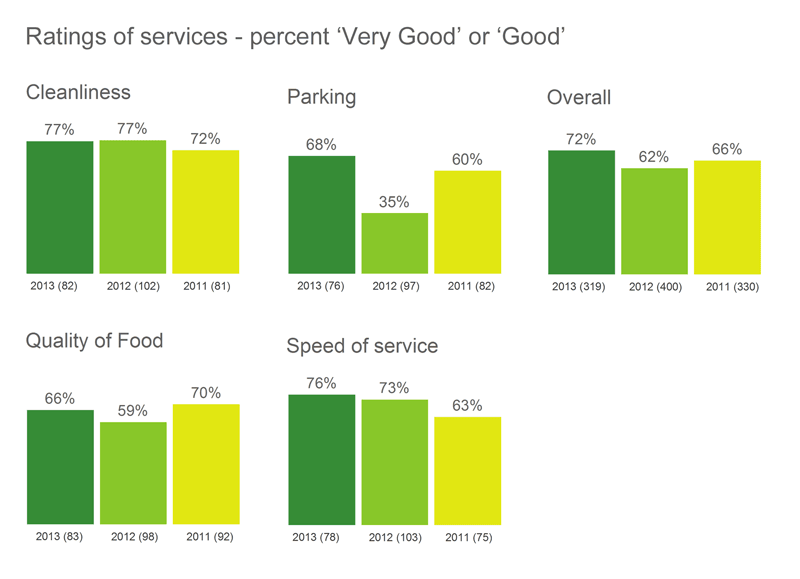
3. Reintroduce only the detail you need. For example, link to your database or other Snap survey to compare results by gender or over time.
Filters
Filter responses to see how different groups answer specific questions. Filter any question or combination of questions whether qualitative or quantitative, for example:
- Males under 18 or females over 40.
- Comments including keywords, for example “recycling”.
- Expenditures of $100 or more.
- Dates between 01/06/2013 and 07/06/2013.
- Responses received from online only or paper only versions of the survey.
Derived Variables
Reorder and simplify your data for example to:
- categorize participants by demographics such as age, or age and gender.
- Combine answer categories, for example ‘Good’ and ‘Very good’ responses in a rating scale can represented in a single new category – ‘Positive.’
- categorize replies according to the year, quarter, month, week or day of the week the reply was given.
- categorize literal comments into groups, such as comments that include a specific word or phrase.
- Assign categories to quantity or open-ended replies.
- categorize replies according to the hour, minute or second of the day the reply was given.
- Perform calculations with survey data, such as determining current age from a given date of birth or the interval between two dates or times.
Group Variables
Combine replies from similar questions to analyze as a whole. For example, question grids rating aspects of service delivery, satisfaction or importance can be summarized as a group.
Context
Tailor analyses or reports for a specific audience. For example:
- View satisfaction scores for one service against all other services combined.
- View results for one location service against all other locations combined.
- View results for one region against all other regions combined.
Scores
Assign scores to specific answer categories and calculate an overall average or mean, which can then be used to summarize results. Scores are often used with gap analysis, for example, to compare results from importance and satisfaction questions.
Net Promoter Scores
Snap Survey Software includes all the tools you need to calculate and report Net Promoter Scores from attitude questions.
Weighting
Apply weights to your survey responses to remove bias, or to make adjustments so that your sample more accurately reflects the known target population:
- Change the proportions/balance of a sample group.
- Increase/decrease the size of a sample group.
- Use as part of a calculation.
- Count items other than respondents (for example, amounts of money).
Database links
See your survey results in a wider context:
- Automatically import data from a database or another Snap survey.
- Automatically export data to your database or other Snap survey.
- Merge similar surveys.
- Join multiple surveys that have the same participants but different questions.