Smileys Survey
For quick and easy feedback that indicates how satisfied respondents are
Our Smileys Survey uses smiley faces that makes it engaging and easy for people to give quick satisfaction feedback.
Participants use smileys to indicate their satisfaction with your brand, product, or service.
You can also add an optional extra question that is fully customisable to suit your needs.
With the click of a button you can generate an average Happiness score.
- One satisfaction question
- Optional extra question
- Generate instant Happiness score based on results
- GDPR compliant
- Easy to use
We’ve done the hard work for you – so there’s no need to be an expert in running surveys!
A pre-built survey that gives quick and easy satisfaction feedback based on your brand, product, or service.
It can be used across any sector or industry and runs on any channel or device.
Participants rate their interaction with you based on which smiley best represents their mood/feeling.
A smile represents satisfaction – and a sad face represents dissatisfaction.
This makes it easy to understand and perfect for surveys in any language.
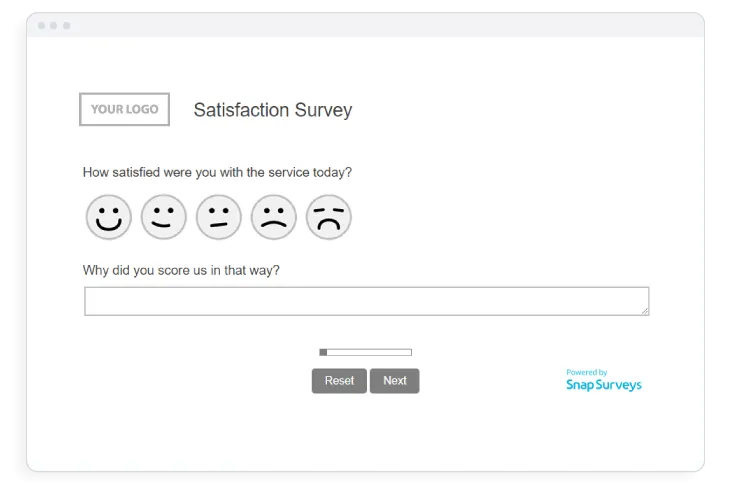
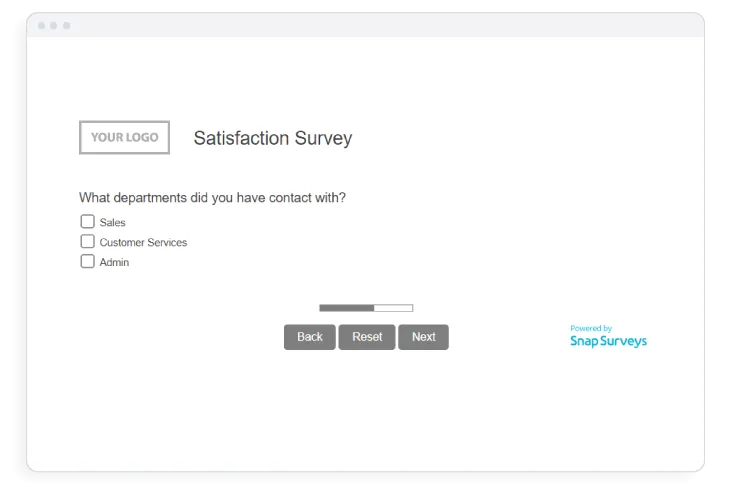
There is also a customisable optional extra question. Write your own question text and select the question style, such as single response, multiple response, or a free-text comment question.
Helping you assess satisfaction levels and make informed decisions to improve products, services, or experiences.
You can also add your organisation’s logo and branding!
Generate visual reports with the click of a button – helping you see the bigger picture
There are 3 reports included in the pre-built Smileys Survey.
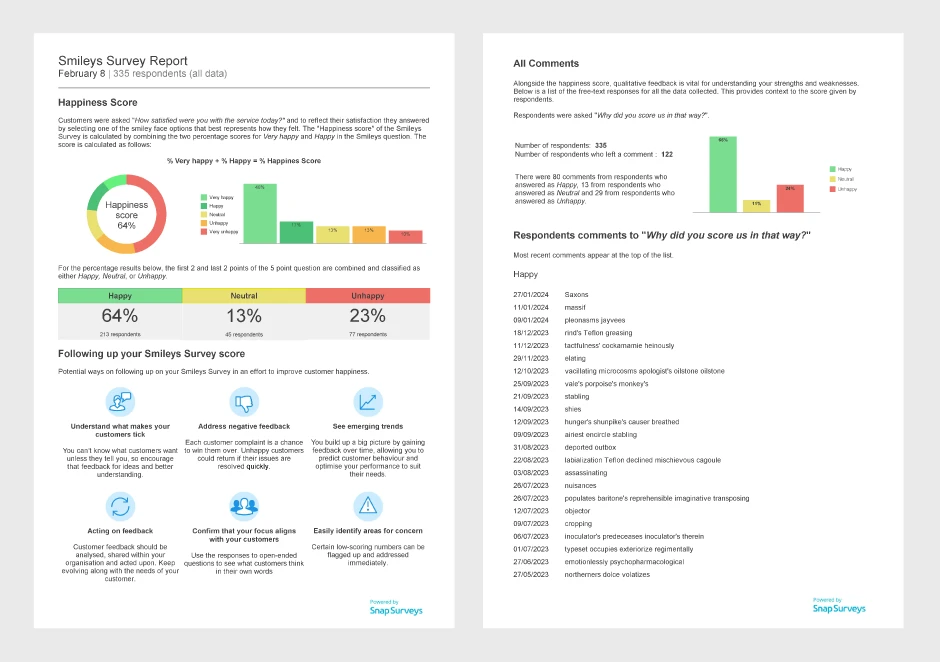
Main report
- A Happiness score = % Very happy + % Happy
- Percentages per smiley face in a bar chart
- Percentage Happy, Neutral, and Unhappy
- Potential ways to follow up the score
- A list of free-text comments for Happy, Neutral, and Unhappy
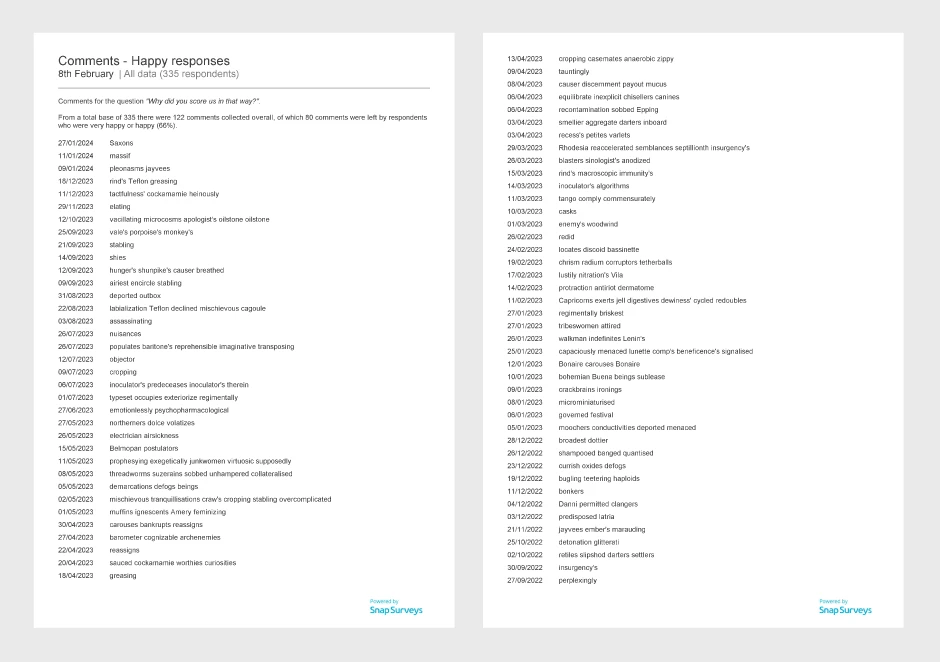
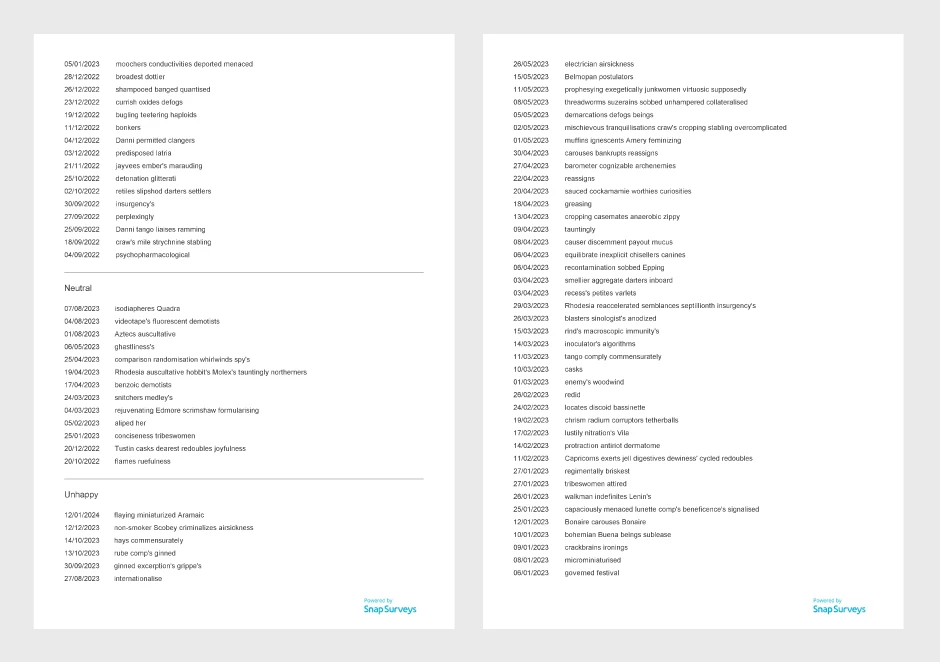
Comments report x 3
- Each report contains a list of free-text comments for Happy, Neutral, and Unhappy
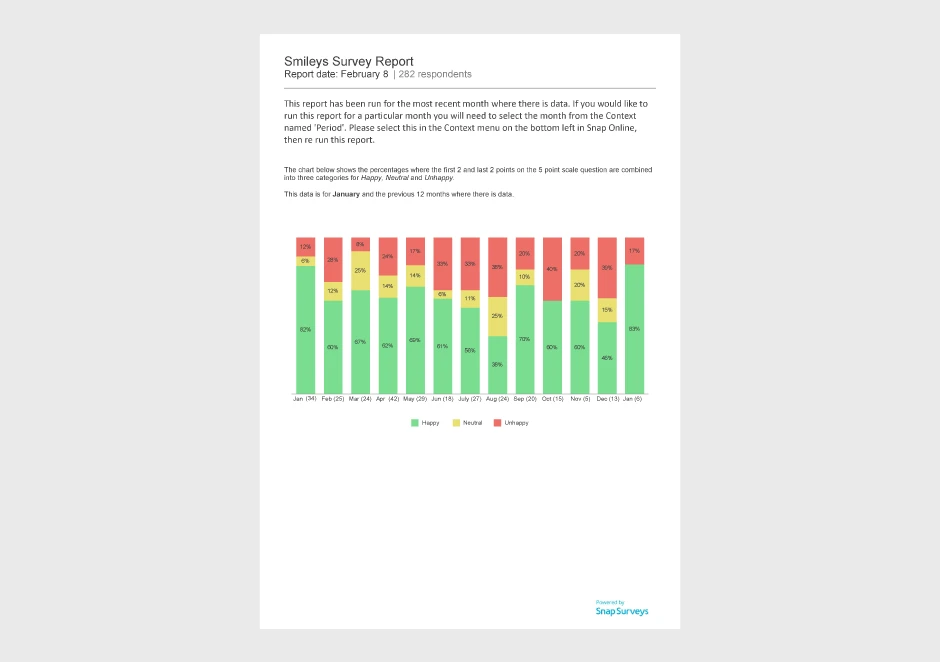
Previous 12 months report
A chart of the Previous 12 months percentages for Happy, Neutral, and Unhappy with filtering by month
If an additional question has been added there will also be a chart and table of this showing percentages per Happy, Neutral, and Unhappy
Make decisions backed by data
The breakdown of data in these reports provides you with the crucial first step to understanding how people rate your brand, product, or service.
With positive feedback, you know that what you are doing is working.
And if your score is lower, you can take the first steps to making positive changes!
Welcome offer: your first 1,000 responses (if used within 12 months) will be free. Additional responses from 6 cents each.