Derived variables
Derived Variables enable you to transform data into new variable types, by combining other variables, including question responses, derived variables and system variables. You can use derived variables in analyses, reports, filters, as well as other derived variables. For example:
- Combining categories within a Multi Choice variable
- Converting numeric data into categories
- Converting date and time data into categories
You create derived variables in the Variable Details window in the same way as other variables.
Creating a new derived variable
- Click the Variables button on the Snap XMP Desktop toolbar to open the Variables window.
- Click
 to open the Variable Details window to create a new variable. The derived variable is given a default name, and the default response is multiple.
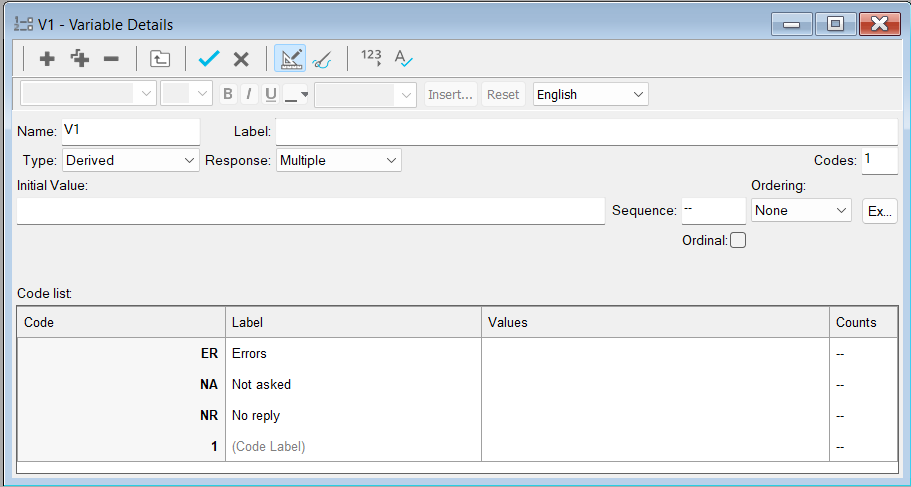
- Click Toggle Definitions
 to show Initial Value and Ordering information.
 - In Name, enter the derived variable name.
- In Label, enter a description of the derived variable.
- In Type, select derived.
- In Response, select from
- Multiple where each case may count in more than one of the new codes
- Single where each case will only count in one of the new codes
- Quantity
- Date
- Time
- Literal
- In Initial Value, enter an initial value that is shown by default.
- If the derived variable is Multiple or Single:
- In Ordering, select the type of ordering: None, Inverse, Forward, Random, Alphabetic.
- Click Ex and select any codes that you want to exclude from ordering.
- If the derived variable is Quantity, in Decimals, enter the decimal places required.
- In Code list, enter the codes required. This depends on the response selected.
- Code is used in analysis
- Label is displayed in tables, charts and clouds.
- The values are filter expressions or calculations that can reference a variable or case.
- Counts shows a count of the data.
- Click Save
 to save the changes and return to the Variables window. Alternatively, click Cancel
  to abandon any changes.
You can update the response count ![]() to see how many responses belong to each code. This is a good method to test a derived variable works.
to see how many responses belong to each code. This is a good method to test a derived variable works.
Literal responses
You can set up derived variables that categorise questions that contain literal responses, such as comments or entries for other items not in the list. We recommend creating a list of comments from the question before creating a derived variable. This gives you an indication of what words you wish the derived variable to look up.
Derived variables in Tables, Charts and Clouds
You can use derived variables in the same way as any standard variable.
Derived variables can be drag and dropped from the variable list or typed into the Analysis field. This can be used in a table, chart or cloud.
Combining categories
Grid questions that have a number of columns ranging from negative to
positive can be combined into categories, such as positive, neutral and negative that can be used in tables and charts. An example of this is available in the tutorial Create a chart of positive responses to rating scale questions.
Quantity responses
Quantity response questions are used to collect open ended numeric responses in a survey. This
type of data would usually be values such as amounts of money, volumes, areas. You can analyse the quantity responses in tables and charts.
Dividing the values up into value ranges helps summarise the quantity data in categories. For example, the amount spent in the shop can be divided up into categories of £0-£4.99, £5 to £9.99, and so on. A Statistics table can help find the range of data you have, helping in deciding your categories. Banding quantity variables for analysis can be used in a chart.
For quantity data a table of descriptive statistics can be produced which shows the mean, mode,
median, quartiles, sum, min, max, range, standard deviation, variance, standard error of the
mean, skewness, and kurtosis. Any of the statistics can be included using the Descriptive
Statistics tab, such as Calculating mean scores after banding a quantity variable.
Date responses
Date questions and variables can be used to record any date between 6 million years BC and 6
million years AD using the Gregorian calendar. They correctly allow for the inclusion of leap years
and for the specification of 4 digit years as two-digit numbers (e.g., 2021 can be expressed as 21).
Years before 1930 and after 2029 must be entered in full. Dates can be analysed and filtered in a
number of ways as follows:
- Dates can be grouped into specified ranges.
- Dates can be categorised as falling into particular years, months, or weeks of the year, or on
particular days of the week. - The difference between two dates (for example between a start date and an end date) can
be calculated as a number of days and grouped into appropriate ranges.
Time responses
Time questions refer to time of day, such as 2pm or 11.00. They do not refer to time periods, such as 1 hour or 30 minutes. However, differences between two time variables will produce a duration in seconds which can be treated as a numeric variable. Time questions enable respondents to give a specific time either in the 12 or 24 hour clock format: 7 am or 6pm or 18.00 or 11 o’clock am or 3 o’clock pm.
Time variables can be filtered and analysed in a number of ways:
- Times can be categorised as falling into particular periods in the day, such as ‘rush hour’; ‘midmorning peak’ or ‘lunchtime’.
- The difference between two times (for example between a time of arrival and a time of departure) can be calculated and the totals grouped into appropriate ranges, such as ‘15 minutes waiting time’;’30 minutes waiting time’ and ‘1 hour waiting time’.