Categorising quantity responses with a derived variable
The following example uses the Crocodile Rock Cafe Survey. A Derived Variable is set up to allocate the data for Q5 “How much did you spend in total?” into ranges.
- Click
 to display the Variables window.
 - Click
 to add a new variable.
 - Specify the Variable Details:
- Name: V5
- Label: Amount spent
- Type: Derived (the variable will derive its data from other existing variables).
- Response: Single (each respondent will only fall into one of the new codes).
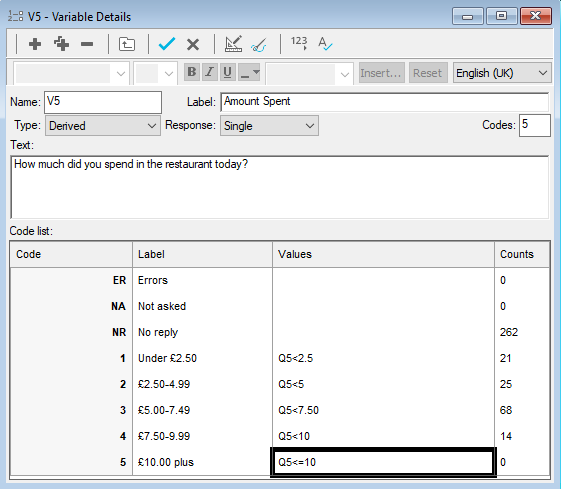
- Specify the Code Details:
Code | Code Label | Value |
1 | Under £2.50 | Q5<2.5 |
2 | £2.50-4.99 | Q5<5 |
3 | £5.00-7.49 | Q5<7.5 |
4 | £7.50-9.99 | Q5<10 |
5 | £10.00 plus | Q5>=10 |
-
Click
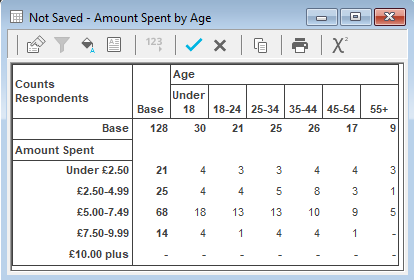
 to save the variable. The variable can then be used in tables and charts in the usual way.