
Advanced survey software solutions such as Snap Survey Software include sophisticated analysis capabilities, for example, Summary Statistics, Descriptive Statistics, and Significance Testing. Summary Statistics reduce large amounts of information to a single figure, thereby allowing comparisons between two or more sets of data. Significance Testing provides a measure of how confident we are that the results obtained for the survey reflect the true pattern of response in the population at large.
When you are searching for a survey software solution, be sure to thoroughly review the analysis capabilities. Below are some statistical features that should be included in any survey software package?
Summary Statistics
Summary Statistics include averages, measurements of the spread of data values, and the divergence of the data values from normal distribution patterns.
Mean, Mode, and Median
The Central Tendency of a distribution is an estimate of the “center” of a distribution of values. All three types, Mean, Mode, and Median are estimates of central tendency. I explain each type using the example below:
Example: 10 groups of guests visiting a new theme park were interviewed and asked the question, “How many people are in your group today?” The following 10 answers were given:
1, 2, 3, 4, 3, 4, 5, 4, 6, 2
The Mean (or average) is the most commonly used method of describing central tendency. The Mean is calculated from the sum of all the values divided by the total number of values.
Mean = 3.4 (the sum of the answers, which is 34 divided by 10)
The Mode is the most frequently occurring value in the data set.
Mode = 4 (since 4 is the most frequently occurring answer, occurring 3 out of the 10 responses)
The Median is the value found in the exact middle of the set of values when the values are put in order from least to greatest, or in numeric order. If there is an even number of values (and hence two ‘middle’ values) then the Median is calculated as the Mean of the two middle values.
Median = 3.5 (when arranged in order (1, 2, 2, 3, 3, 3, 4, 4, 5, 6), the middle values are 3 and 4. Since there are two middle values, the Median is calculated as the Mean of the two middle values, in this case the sum of the two values 3 & 4 divided by the total number of values, which is 2. (3 + 4) / 2 = 3.5.
Minimum, Maximum, Range, and Quartiles
The Minimum, Maximum, Range, and Quartiles are used to determine the spread of the data values. Range shows the spread of the distribution and is calculated by subtracting the smallest value (minimum) from the largest value (maximum).The Quartiles are one-quarter (1st Quartile – 25% ) and three-quarters (3rd Quartile – 75%) of the way through a range of values. Range and Inter-quartile range (the difference between the upper- and lower-quartiles) are basic measures of the spread of the survey data.
Variance, Standard Deviation, and Standard Error
The Variance, Standard Deviation, and Standard Error of the Mean measure the entire spread of data in a more advanced way. All methods are used in Significance Testing and are calculated by taking every data value into account. Variance and Standard Deviation measure how much each individual response differs from the Mean of all responses. If the distribution of data from the survey is closely grouped, the difference will be relatively small. If the distribution of data is widely spread, the difference will be bigger. Standard Deviation is a measure of the spread of values in a distribution and is calculated by taking the square route of Variance. It gives an indication of how much the values deviate from the Mean. Standard Error of the Mean is the Standard Deviation divided by the square root of the survey sample size.
Normal Distribution
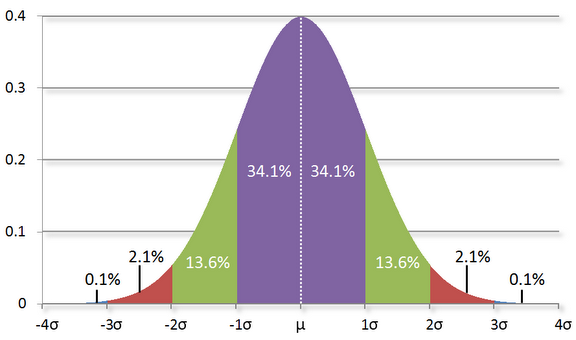
Normal Distribution is also referred to as the bell-shaped curve. The bell-shape of the Normal Distribution makes it a convenient choice for representing a large variety of random variables. Normal Distribution is a pattern of data that fits many naturally occurring scenarios, e.g. height and weight of adult humans. Many statistical tests assume the data are distributed normally. Statistical tests exist to examine whether or not data are normally distributed.
Graphical representation of Normal Distribution
Kurtosis and Skewness
Kurtosis and Skewness measure the degree to which a set of data values differs from the Normal Distribution. There are several ways of calculating Kurtosis and Skewness for a distribution of data and compatible ways of estimating them from a sample of a population. It is, however, very rare that either Kurtosis or Skewness are used or referenced.
Kurtosis measures the whole extent of the distribution curve – a positive value or high Kurtosis distribution is evident in a sharp peak and longer, flatter tails (that is, the data is clustered around the central mean). A negative value or low Kurtosis distribution has a more rounded peak and a shorter, thinner tail, which indicates that the distribution is flatter and more spread out than normal.
Skewness measures the extent to which the tails of the data may be more drawn out on one side than the other. The Skewness value can be positive or negative, or even undefined. A value of zero or a value close to zero indicates that the left- and right-hand sides of the distribution are balanced. If the Skewness is positive, then the peak of the graph (the Mode) is closer to the left-hand side. If this occurs, the Mean value is greater than the Median. If Skewness is negative, then the opposite is true – the Mean is less than the Median, and the peak of the graph shifts to the right-hand side.