
What is cross tabulation?
When conducting survey analysis, cross tabulations (also referred to as cross-tabs) are a quantitative research method appropriate for analyzing the relationship between two or more variables. Cross tabulations provide a way of analyzing and comparing the results for one or more variables with the results of another (or others). The axes of the table may be specified as being just one variable or formed from a number of variables. The resulting table will have as many rows and columns as there are codes in the corresponding axis specification.
In many research reports, survey results are presented in aggregate only – meaning, the data tables are based on the entire group of survey respondents. Cross tabulations are simply data tables that present the results of the entire group of respondents as well as results from sub-groups of survey respondents. Cross tabulations enable you to examine relationships within the data that might not be readily apparent when analyzing total survey responses.
The benefits of cross tabulation
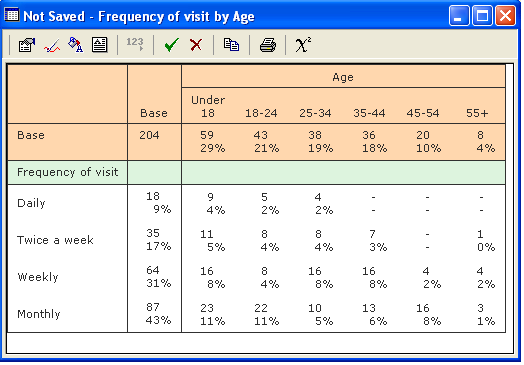
The benefits of using cross tabulations in survey analysis are best illustrated through the following example. Using advanced survey software with built-in analysis capabilities, you can analyze the frequency of visits and break the results down by age. The choices for the first question are displayed to the left (the row labels) of the table data. The second question choices are displayed across the top of the table (the column headings). This association can be flipped if needed.
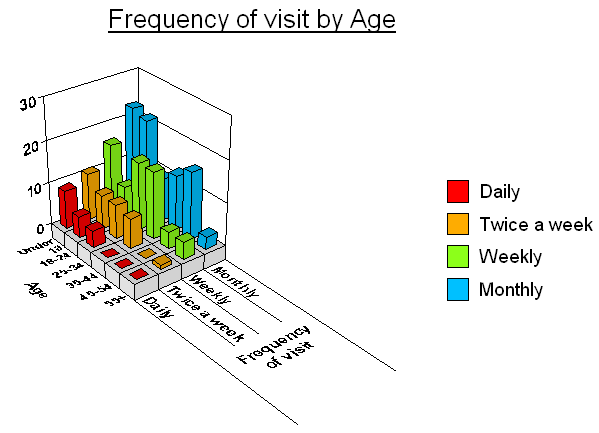
You can easily take the information from this cross tabulation and create a visual chart or graph. In the example below, we created a simple three-dimensional bar chart in Snap Professional. You can easily customize the type of chart or graph, fonts, and colors to match your theme or brand.
This example gives you a brief look at how you might use cross tabulation analysis for your own survey. Cross tabulations can help you explore your survey data to uncover hidden relationships between items.
Survey analysis tool
With Snap Survey Software it is very easy to generate complex tables. Snap Survey Software has the ability to cross analyze one question against a number of other questions, and produce presentation-quality tabulations. Tabulations of up to 5 million cells are possible, with a maximum of either 2,000 rows or 2,000 columns. Each table can be made up of a number of variables.
If you want to learn more about cross-tabulations, or more advanced analysis with Snap Survey Software, see our analysis training courses.