Table appearance
You can control the appearance of an analysis table by changing fonts, colours, grids, highlights and sizing. You can save your style for later use. You make the changes from the table style menu: Edit Styles, Separators, Sizing, Options, Load Style and Save Style.
There are two ways to open the menu from the Table window
- right-click the table
- press the F2 function key
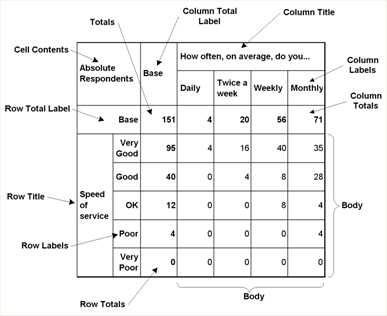
There are 11 different areas or regions in any table and any combination of these areas can be altered independently using the Edit Styles menu item. This allows you to change the way the contents of the rows and columns look. You can change the color of the text and background, the font used, and where the text appears. It is advisable to make consistent alterations to a table, such as all totals to be bold, all labels to be italics, etc. so that the table is easy to read.
- The Separators menu item allows you to specify highlighting of table rows and columns (for example, highlighting alternate columns so they are easier to read). You can also insert blank rows and columns to break up the table.
- The Sizing menu item allows you to force the table cells to be a specified size.
- The Options menu item allows you to decide whether the question label headings and totals rows and columns appear.
Defining the table style
Open the Define Table Styles dialog from an Analysis Display window displaying a table by
-
Click
 on the Analysis Display toolbar
- click F2 or right-click the mouse and select Edit Styles from the list displayed.
You can use this dialog to:
- Changing the lines between table rows and columns
- Changing the highlighting and separation of rows
- Changing the position of text in table cells
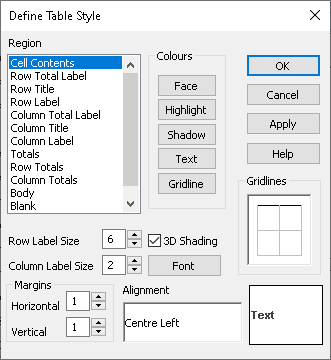
Region | Select item(s) you wish to change |
Colours | Click button to change colours of those options for the selected regions |
Face | Change the background colour of the cell |
Highlight | Set the highlight colour on top and left of cell |
Shadow | Set the shadow colour on bottom and right of cell |
Text | Set the text colour |
Gridline | Set the gridlines colour |
Row Label Size | Set the maximum number of lines displayed in a row. This defines the length/width of the rows and columns and gives the point at which the text wraps. |
Column Label Size | Set the maximum number of lines displayed in a column label. This defines the length/width of the rows and columns and gives the point at which the text wraps. If the value is set to 1, then all text will be placed on one row. This may result in very wide tables if the column label size is set to one. |
3D Shading | Clear to remove highlights and shadows from cells |
Font | Click to set the font type, size and style for the selected area |
Gridlines | Click image to select or deselect which lines to display and whether crossing points are displayed |
Margins | Specify the distance from text to the borders of the table cell |
Alignment | The Alignment options are used to position text and decimals within a table cell. Click in the Alignment area to specify the position of the text. The default style aligns all text in cells as Centre Left. There are nine locations: Top Left; Centre Left; Bottom Left; Top Centre; Centre Centre; Bottom Centre; Top Right; Centre Right and Bottom Right. |