Exporting response data to Power BI
Microsoft Power BI is a business intelligence product developed by Microsoft, that is used to analyse and visualise an organisation’s data. Power BI can connect to a range of data sets, including response data from Snap XMP.
There are two ways to connect Snap XMP response data to Power BI:
- Export the response data file in CSV format to use in Power BI
- Use the Snap XMP API directly in Power BI
Exporting the response data file in CSV format
- Log into Snap XMP Online and open the survey.
- In the Summary tab, click Collect to go to the Collect section.
- In the Collect menu, click Responses. This opens the Responses section where you can manage the survey’s response data that has already been collected.
- In Export Options, select the CSV export option. Managing response data contains further information on the available export options.
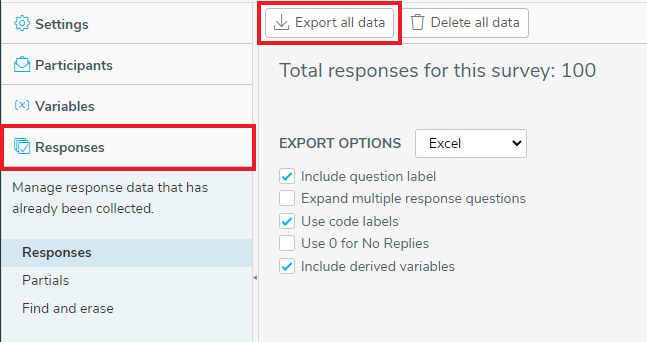
- Click Export All Data to export all the responses to a CSV file. This saves the file to the Downloads folder set on your device.
- Once downloaded, open Power BI and select Get Data.
- In the Get Data dialog, which opens up, select Text/CSV, then select the exported data file and click Open.
- Once loading is complete, you can view the response data. You can check the data looks the way you want then click Load to load the data into Power BI. There is an option to transform the data before loading, if required.
This option uses a snapshot of the response data at the time you exported the file. To update the data, repeat the process by exporting the file, giving it the same name, then re-loading it into Power BI.
Using the Snap XMP API directly in Power BI
Before using the API, the Snap XMP Online account being used will require an API permit.
- If you are using the Snap Surveys Subscription service Snap Surveys will set up the API permit.
- If you are using an On-Premises service, your organisation will set up the API permit.
Please note that when using the API:
- software development experience may be required.
- there is a unit cost associated with using the API.
Finding the survey GUID
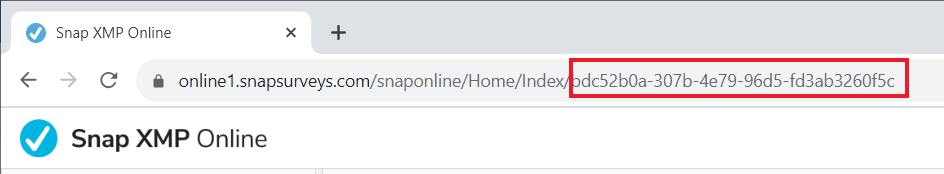
Each survey has a unique identifier, called a GUID. This API uses the GUID to link to the survey. The survey GUID can be found in Snap XMP Desktop and Snap XMP Online.
Snap XMP Online
Log into Snap XMP Online and open the survey. The survey GUID forms the last section of the URL.
Snap XMP Desktop
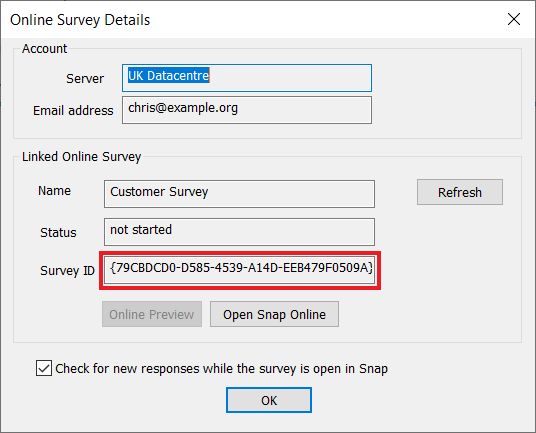
- Open Snap XMP Desktop and from the Survey Overview, select and open the survey.
- Click the Tailor | Online Details menu. The Survey field contains the survey GUID.
Getting data using the API
- Open Power BI and click on the Get data text.
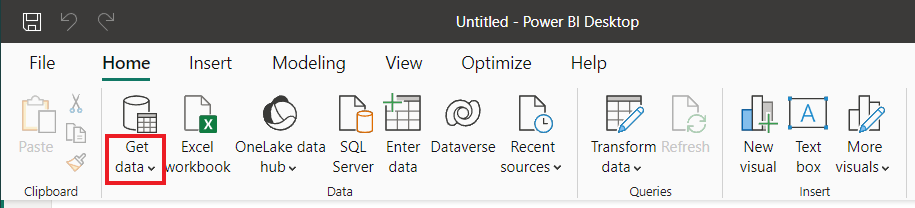
- Select Web from the list of Common data sources.
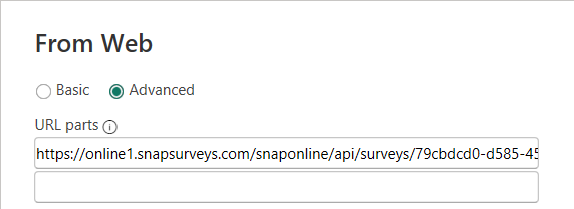
- In the From Web dialog, click Advanced to expand the options.
- In URL parts, enter the URL that calls the API. For example the URL to return response data is:
https://<servername>/snaponline/api/surveys/<surveyGUID>/responses?returnCaseIds=true&useCodeLabels=true- The URL is case sensitive for the options at the end.
- <servername> is the name of the server, such as online1.snapsurveys.com or online2.snapsurveys.com if you are using Snap Surveys Subscription service,
- <surveyGUID> is the unique GUID for the survey you are using.
- Next add in login information required by the API. In the HTTP request header parameters add your username, API key (Password) and API version info.
- Enter X-USERNAME with the Snap XMP Online account email address. Click Add header.
- Enter X-API-KEY with the user’s API key. Click Add header.
- Enter X-VERSION as 2.0.
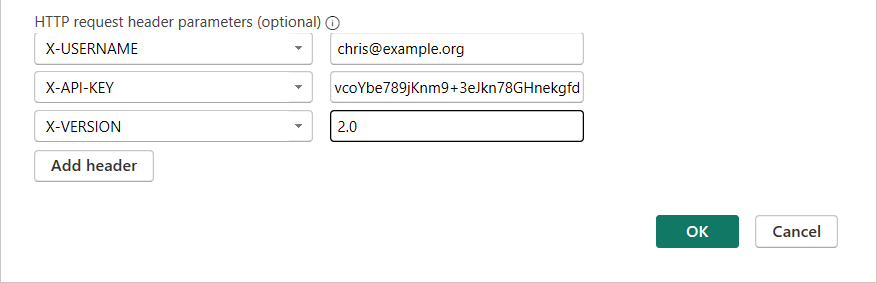
- Click OK
- The first time you enter the login information, it will ask what credentials you want to use. Select Anonymous from the left side. (This is not actually anonymous since the login details have been passed through and will be used for authentication.)
- Select the API level for access. For example, for any API call use “https://<servername>/snaponline/api” replacing <servername> with the name of the server you are using.
- Click OK.
- Click Close and Apply to load the data. The API data is one row per variable, so each column has just a list of one aspect of the variable (one column for variable number, one for responses, etc.)
Using the API, means that you can refresh the response data from Power BI and the data is kept up to date. Be aware that there is a unit cost associated with using the API.
You can use the API to return a number of different data sets for your surveys.
Transforming the response data
Once the response data is in Power BI, you can change the data.
We recommend that you duplicate the response data before making changes. This is for safety so that you have your original data to return to, if necessary, and if you are using the API there is a unit charge for re-loading the data.
In Power BI, click Transform data. This opens a spreadsheet-style view of the data.
Some example transformations are:
- If the response data uses a header (top) row, this will load as a data row and populate in your chart. You can choose to use the first row to name your column headers or you can remove rows by selecting Remove rows>Remove top rows then enter “1” to remove the top row.
- Apply a filter by clicking the drop-down next to the column that you want to transform. Select the filter from the options, then click OK.
- Remove unwanted columns by selecting the column, right-clicking then selecting Remove Columns from the pop-up menu.
If importing the data via the API the recommended transformation sequence is:
- Apply a filter by clicking the drop-down next to the responses.status column so you exclude cases marked as deleted if you have them.
- Remove unwanted columns by selecting the column, right-clicking then selecting Remove Columns from the pop-up menu. You need to keep responses.caseID, responses.variables.id and responses.variables.v
- Select the responses.variables.id column and use the Pivot column option from the Transform menu:
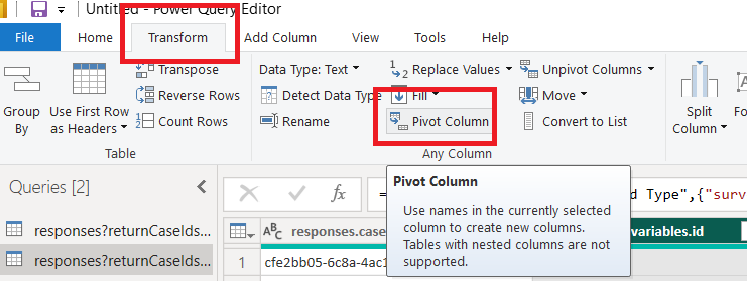
- Select responses.variables.v as the Values column, select advanced and change the function to don’t aggregate and press OK
Click Close and apply to save all the changes.
Using Power BI for charts
There are a variety of visualizations that you can create in Power BI, including charts.
When you have loaded your data set the data source is shown in the Data section. Expand the data source to view the columns.
In the Visualizations section, there are a number of charts that you can select.
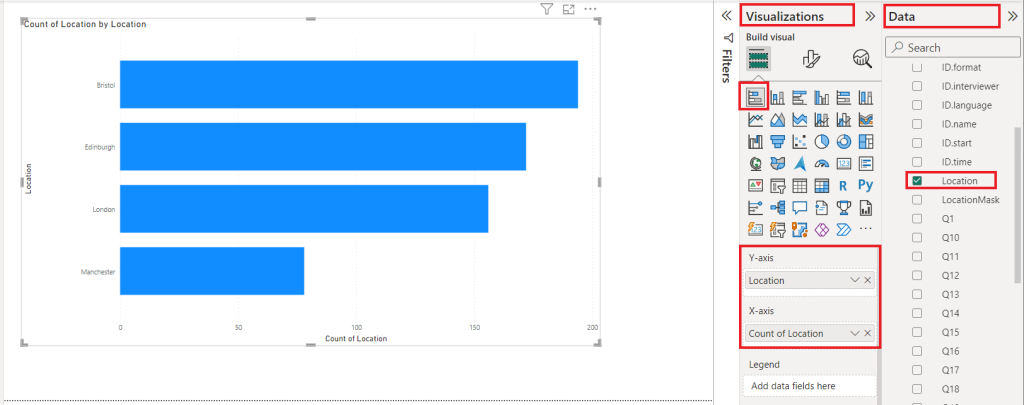
Example: Stacked bar chart
To add a chart:
- In Visualizations, click on the Stacked bar chart icon to add it to the display area.
- In Data, select or drag a data column, e.g. Location, to add it to the Y axis.
- Drag the data column to the X axis to view the location counts.
Refreshing data
Using the API, means that you can refresh the response data from Power BI, by clicking Refresh. The connection to the data keeps it up to date.
For refreshing data obtained from an exported CSV file:
- In Snap XMP Online, re-download the CSV data export file, keeping the same file name and location. This can be done by overwriting the original file or deleting it ahead of time and replacing it with the new one.
- In Power BI, click Refresh to load the latest response data.
The next step is to publish.
Publishing data
When you have completed your chart or updated the data, you will need to publish the changes.
- In Power BI, click Publish.
- Select a publish location, such as, “My Workspace” and click Select.
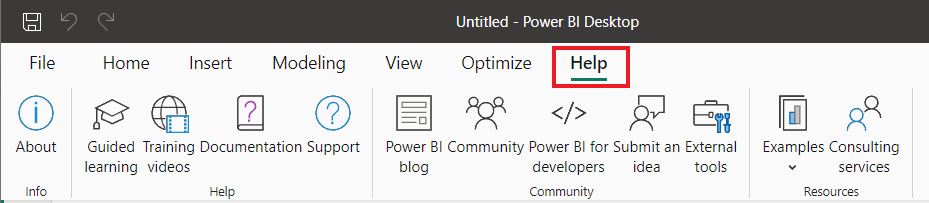
Further Power BI help
For further help with Power BI you can access guided learning and videos from the Help menu.