Event Template

The Event Template lets you create a survey with a number of standard questions that help you find out how satisfied your customers are with your organisation’s service.
You can customise the questionnaire design by editing the text, adding images and adding questions to create your own exit interview survey.
Included questions
As well as single choice and multiple choice questions, the template features rating questions, a date question and an inline question.
5-point satisfaction rating
The 5-point satisfaction rating question helps you find out how easy your customers were able to contact customer services.
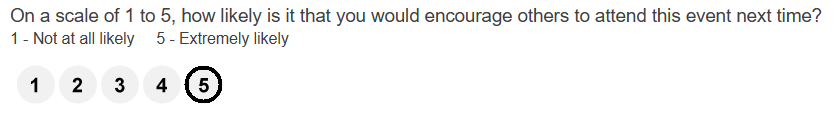
Use the Desktop app to customise the rating question.
Smiley emoji rating
The emoji rating questions help you find out how satisfied your customers are with your product or service.
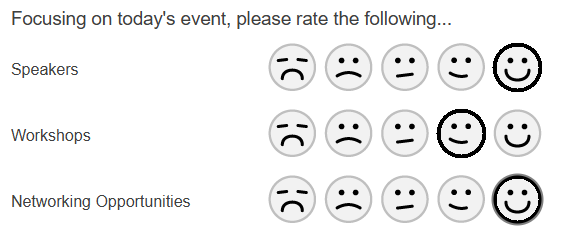
Use the Desktop app to customise the rating question.
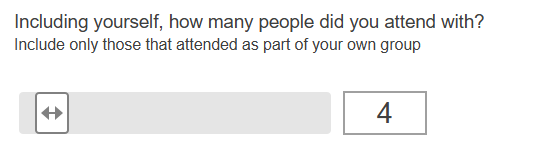
Slider control
Enter a number, within a range, easily using the slider.
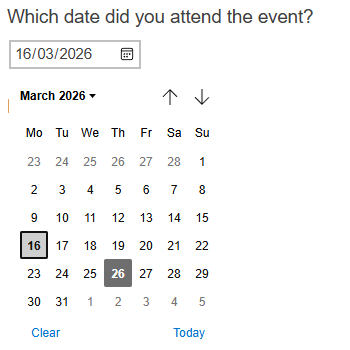
Date question
Enter a date easily, using a calendar. Customise the date format to your region.
Customising the questionnaire
You can include your own images, and add new questions.
The font style and colour can be edited using the formatting options on the toolbar.
Saving the questionnaire
When you have finished click Save to save the changes.
Available editions
The template has four editions for Paper, PC/Laptop, Tablet and Phone. Click the editions drop-down to choose from the available languages and modes.
Publishing the questionnaire
You can distribute and collect responses online and on paper. Publishing the questionnaire lets you:
- send the interview URL and QR code to respondents, asking them to complete your questionnaire
- preview the online questionnaire
- publish and download a PDF version to print out
Standard reports included
There are four standard reports included to help analyze the survey’s responses.
- Questionnaire report generates a top-line summary report showing the counts or percentages of responses in the questionnaire layout
- Summary report generates a chart, table or list for every question
- Summary Tables report tabulates responses to all questions
- Summary Dashboard report generates an HTML summary report with images of each chart, table or list for each question and displayed in a double column format.