Viewing the Summary Dashboard report
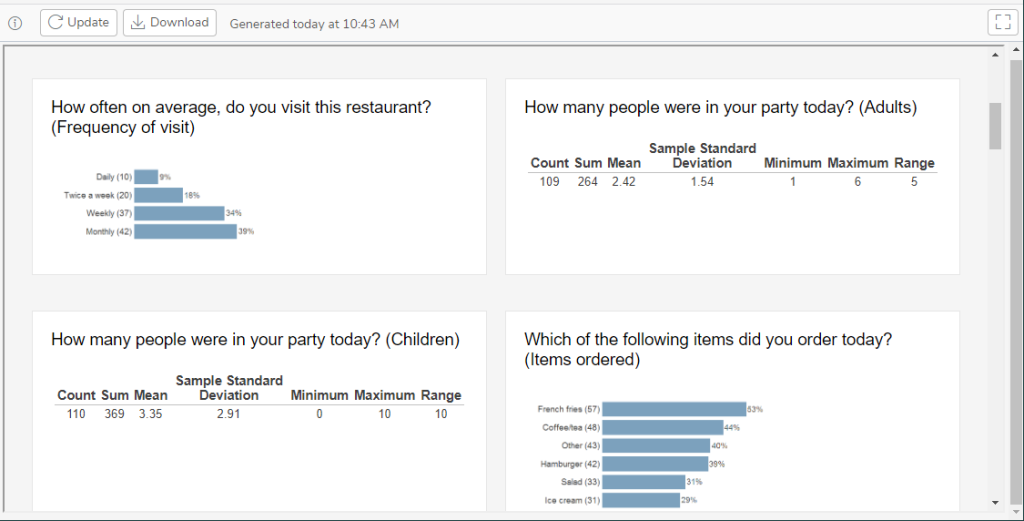
The Summary Dashboard report is a new addition to the three standard reports that are already available for surveys in Snap XMP: Questionnaire, Summary and Summary Tables. The Summary Dashboard report generates an HTML summary report showing images of a chart, table or list for all relevant questions. The report displays the images in a double column format. This report is available for surveys created using Snap XMP Desktop build 12.10 and after.
To find more information on viewing the standard reports online, see Viewing the reports.
Viewing the Summary Dashboard report
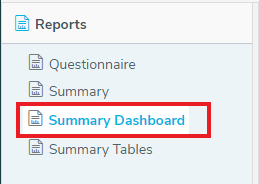
The standard reports are in the Reports side menu in the Analyze section.
- Click on Summary Dashboard in the Reports menu to generate the analysis from your survey responses. You can run reports on your survey data while interviewing is taking place as well as after interviewing has closed.
- The default web browser for your device displays the report.
- You can click the
 button to maximise the report to view it in full screen. Click it again to go back to the standard view.
 - Hovering over the
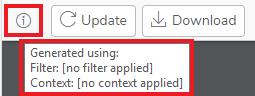
 icon displays the filter or context information that has been applied to the current report.
Updating your report with the latest survey data
Usually you will want to work with the latest survey results as your survey runs.
- In the Analyze tab, select the Summary Dashboard report.
- Click on the Update button to update the report with the latest survey data

- You can see the the generated time for the response data.
- The Update button refreshes the data when new responses are available, when the filter or context applied changes, or when the time elapsed since the report is over an hour ago.
Downloading the report and images
You can download a report as an HTML file and then import into other applications to further analyze the survey responses.
- In the Analyze tab, select the Summary Dashboard report.
- Click on the Download button to download the HTML report and the image files for each analysis in a ZIP file.

- The download is in the Downloads folder (or other location determined by your device and browser settings) as a ZIP file.
Printing your report
You can print any of your reports using the following instructions.
- In the Analyze tab, select the Summary Dashboard report.
- Right-click on the report to show the pop-up menu. Click on Print.
- Enter the print information required and click Print to print the report.