Inserting dynamic data from a ranked table to put highest and lowest values in your report
When you create an analysis table in Snap the table columns are normally ordered according to the variables in the analysis definition. You can sort columns in forward and reverse order by the values of Analysis Label, Analysis Base and Summary Statistics.
This means that you can know that the first column of a sorted table will have (for example) the lowest mean value.
You can access the contents of any table cell or label, so you can dynamically access the appropriate data for whatever aspect has the lowest mean value and use that data in your report. You can also insert the text from the column label in your report.
The example below shows how to use the data from a ranked column in a report Information instruction to add dynamic text to your report.
It uses
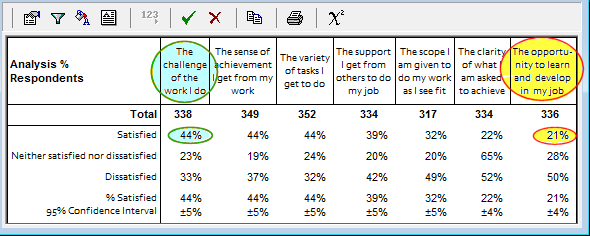
- A table ordered by the mean percentage with the highest scores in the first column and the lowest score in the seventh column. Please note that this topic contains no information on how to create this table.
- An Information instruction which references table cells and labels from the first and seventh column
- Set up the ratings table definition and add the Mean to the summary statistics (you will need to ensure that the mean is scored if you are analyzing coded questions).
- Set the ordering to be by the mean.
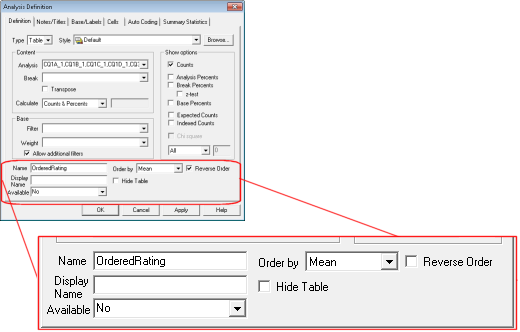
- Click Apply to display the table.
- Open the report that you wish to add the dynamic information to.
- Create an Information instruction.
- Add any fixed text. Click Insert and select Cell Value field… from the drop-down list.
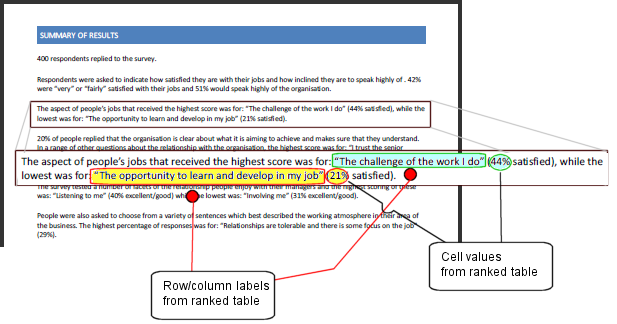
- Enter the table name and cell or label reference that you wish to insert. The example below shows references to the cells and labels highlighted in the table T4 shown above (T4 C1 Label, T4R1C1, T4 C7 Label and T4R1C7).
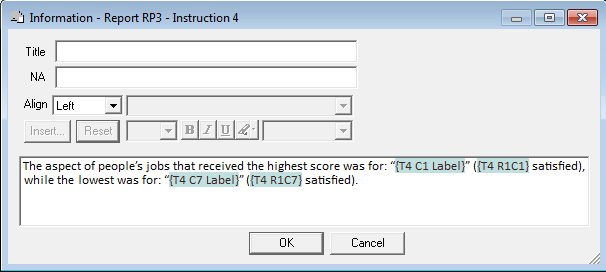
- Click OK to save your instruction.
When the report is generated, the table labels and cell values will be dynamically inserted into the report