Using RIM weighting to balance sample proportions
Balancing the sample of data responses allows you to adjust the proportion of respondents in your sample to match more closely the proportion in the target population. This target may align the demographics of the respondents to those in a census or an industry benchmark. For example, you can balance the age of respondents to match the age ranges recorded in the local country’s census. You can also set the proportions to show an even distribution for each age range.
In Snap XMP, RIM weighting provides the ability to set target totals for one or more variable so you can achieve, as closely as possible, a target distribution of results across the survey’s data.
Assessing sample proportions
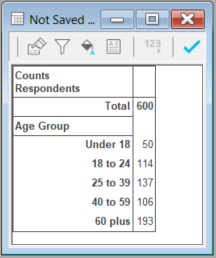
First, use an analysis table to view the proportions of the survey dataset.
- Click Analysis Table
 to display the Analysis Definition for a table.
 - In Analysis, enter the variable that you want to balance, for example, age ranges. Make sure Counts is selected as well as Respondents on the Base/Labels tab.
- Click Apply to display the table.
Creating the RIM Weight
Next, create the RIM weight to change the proportion of each age range.
- Click Analysis Variables
 to open the Analysis Variables window.
 - Click New Analysis Variables Item
 , which displays a menu of analysis variable types to choose from.
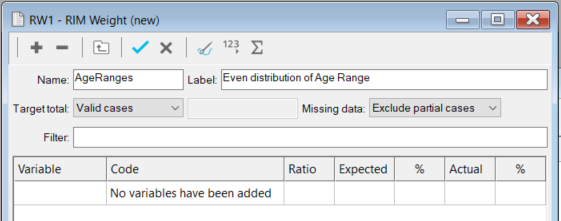
 - Click New RIM Weight to open the RIM Weight window. Note there is an initial error in the status bar as there are no variables references yet.
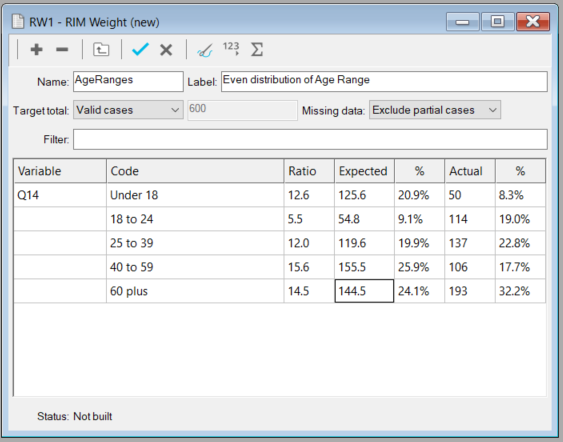
- In Name, enter a name which describes the RIM weight.
- In Label, enter a description of the RIM weight.
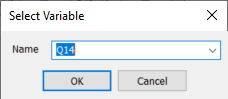
- Click Add Variable
 to open the Select Variable dialog.
 - In the Name drop-down, select the age range variable as the weighting variable, and click OK.
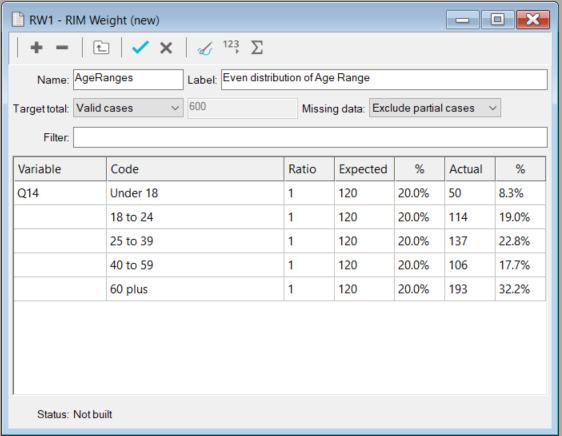
The grid shows the ratio, expected count and percentage as well as the actual count and percentage.
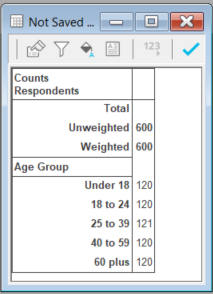
Even distribution example
This example creates an even distribution for each age range.
In Target total, select Valid cases the required option. Valid cases bases the RIM weight on the valid data responses in the survey. The default ratio is 1 to give an equal distribution for all variable codes.
After entering the ratios you need to build the RIM weight.
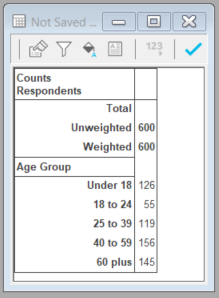
Demographic distribution example
This example creates a distribution based on a census result.
| Age range | Population (millions) |
|---|---|
| Under 18 | 12.6 |
| 18 to 24 years | 5.5 |
| 25 to 39 years | 12.0 |
| 40 to 59 years | 15.6 |
| 60 plus | 14.5 |
In Target total, select Valid cases the required option. Valid cases bases the RIM weight on the valid data responses in the survey. The default ratio is 1 to give an equal distribution for all variable codes.
Change the ratio to that of the population for each age range.
After entering the ratios you need to build the RIM weight.
Build the RIM Weight
The status of the RIM Weight displays in the status bar at the bottom of the RIM Weight window. When the RIM Weight is created the status shows as Not built.
- Click Build RIM Weight
 on the RIM Weight toolbar to build the RIM weight.
 - The Status changes to show Built. If there is an error in the RIM weight the status bar will show an error message and the RIM weight is not built.
- Click Save
 to save the RIM weight.
If the survey receives more responses after you have built the RIM weight, then you will need to rebuild the RIM weight manually as the weight is not updated automatically.
Using the RIM Weight
Create the table analysis using the RIM weight to change the proportions of the sample group.
- Open the Analysis table created for the age range.
- In Weight, enter the name of the RIM weight.
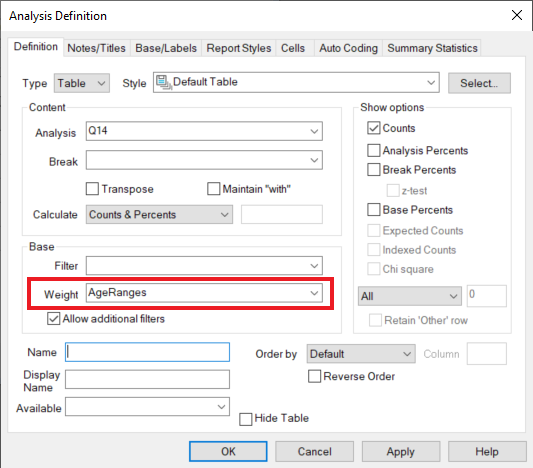
- Click OK to build the rim-weighted analysis.
The RIM weight can be saved and used on any other table or chart.