Adding report instructions
Types of report instructions
A report contains report instructions that either specify how the report will appear, or put content into the report.
The different report instructions are:
Tailor Analysis | This sets the standard options used in the report, and when used at the beginning ensures that the report always runs with the same initial settings. By default, a new report contains a Tailor Analysis instruction as the first instruction, but you may include one at any point. After a report has been run the Tailor Analysis settings are automatically reset. |
Table, Chart, Cloud, List or Map | This defines an analysis that is used only in the report. You can produce multiple tables and charts using Frequency as the Break, as well as single tables for grids, holecount and statistical tables. |
Execute | Execute or run existing analyses or other reports as part of the current report. If you use it to execute an analysis, the analysis will be created exactly as defined. |
Page Layout | You can change the page layout by setting the orientation, numbers of columns, change headers, including page breaks and changing fonts. |
Window size | Set the window size to ensure consistency in the way charts are printed. |
Information | Insert information containing words, images and dynamic text. |
Text grid | Insert a grid containing words, images and dynamic text. |
In addition there are three pre-built reports that are included with every new survey. These pre-built reports can be included as an instruction in any other report. These are covered in more details in the help topic The standard reports.
Questionnaire Report | This report shows a brief overview of your data as a count and/or a percentage for each question in the format of your questionnaire. |
Summary Report | This report gives a chart for each single or multiple response question, a mini statistics table for each quantity response question and a list for any literal response question. |
Summary Tables Report | This report tabulates responses to all questions. |
Creating a report instruction
-
Click Reports
 to open the Reports window showing a list of reports for the current survey.
- Double-click the Report where you want to add an instruction. This opens the Report definition dialog.
-
Click New Instruction
 on the Report definition dialog toolbar. This opens a menu with the list of available instructions.
- Click on the type of instruction you want to create. This opens a report instruction dialog that depends on the instruction selected.
Tables, Chart, Cloud, List and Map Results Definition
The Results definition window is a simplified version of the Analysis Definition window that includes the Definition and Notes/Titles tabs.
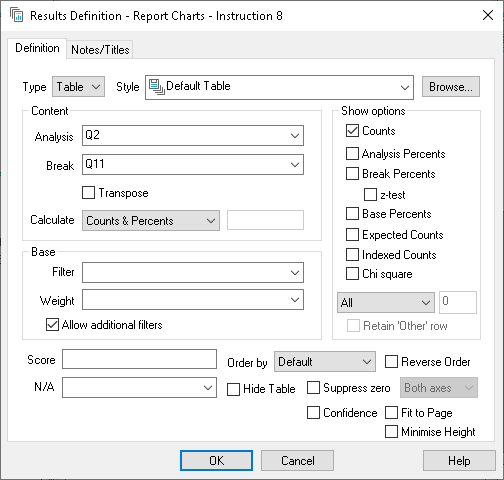
| Definition tab | This tab defines the name and style of the analysis (table, chart, cloud, list or map) and the data analysed. The values in the Analysis, Break and Filter fields can be used to produce multiple tables, charts, lists and maps in the report. |
| Notes/Titles tab | Defines the titles and note text that appears on the analysis. |
Tailor Analysis
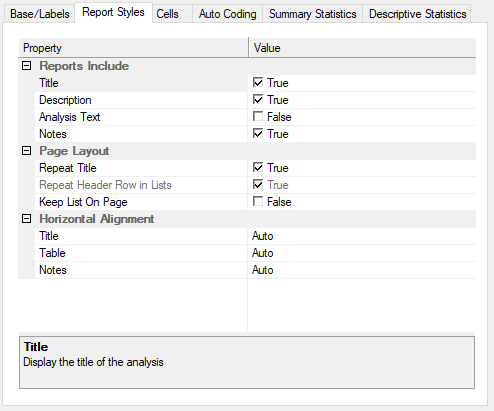
The Tailor Analysis instruction sets the default options for the analysis while the report is running. When a report is created it contains one Tailor Analysis instruction. The Analysis Tailoring dialog is similar to the Analysis Definition dialog used to create Analyses. The Tailor Analysis has six tabs.
| Base/Labels | Define the base used for the analysis; select the bases to display and set templates for the labels. |
| Report Styles | Select or clear the report style check boxes to show or hide titles and descriptions in the report and to select the horizontal alignment. |
| Cells | Define how the data appears in the table cells. |
| Auto Coding | Defines how to automatically generate variables for analyses, especially word clouds, built from open response questions |
| Summary Statistics | Choose the advanced statistics that are displayed for the analysis. |
| Descriptive Statistics | Choose the descriptive statistics that are displayed for the analysis. |
Execute
Saved analyses and other reports are run using the Execute instruction.
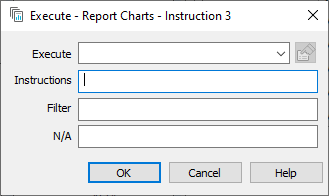
- Enter an Analyses or Report in the Execute box.
-
Click View Analysis
 to see the selected analysis or report.
- If you have selected a report, enter the range of instructions to be executed in the Instruction box.
- Filter your report or analysis data by entering an expression in the Filter box.
- Specify a condition which stops the report or analysis executing by entering an expression in the N/A box.
- Click OK to create the Instruction.
Page Layout
The Page Layout dialog contains three tabs.
- Page Breaks
- Page Setup
- Report Fonts
Page Breaks
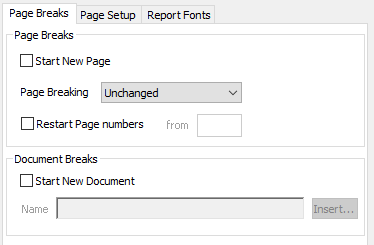
- Select the Start New Page check box to create a page break and put the subsequent content on a new page.
-
There are three types of Page Breaking.
- Unchanged uses the existing method of page breaking.
- Break between items puts a page break between every instruction.
- Continuous report starts a new page if the next item does not fit on the current page.
- Select the Restart Page numbers check box to start the page number from the entered number.
- Select the Start New Document check box to put the subsequent content in a new file. This is normally used when creating multiple reports.
- Use Insert to use one of the fields as part of the filename.
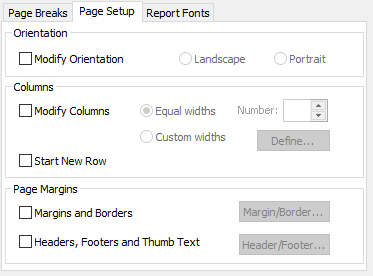
Page Setup
On the Page Setup tab, modify the page orientation, modify columns, and set page margins, borders, headers, footers and thumb text
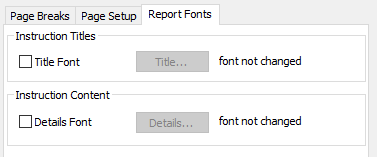
Report Fonts
On the Report Fonts tab, select the fonts for the Instruction Titles and the Instruction Content.
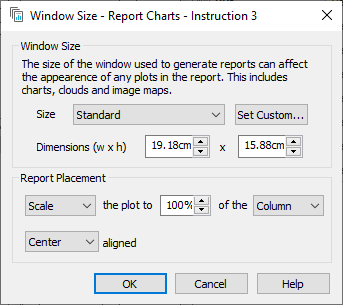
Window Size
Use the Window Size dialog to change the size of the window and change where the report is placed in the window.
Setting the window size
- To use the default window size select Standard in the Size box.
- To set custom window dimensions click Set Custom.
- In the Set Window Size dialog, change the size of the dialog by dragging the sides or bottom corners.
-
When you have set it to the required size click Save
 .
.
Setting the analysis placement
- Resize the analysis to always fit the specified space, select Scale in the box.
- Resize the analysis only if it is larger than the specified space, select Limit in the box.
- Set the percentage of the Page or Column that the analysis occupies.
Example
Scale the plot to 80% of the Column resizes the analysis to fill 80% of the current column.
Limit the plot to 80% of the Page reduces the size of the analysis if it is larger than 80% of the page.
Information
Content containing words and images can be included in the report using the Information Instruction.
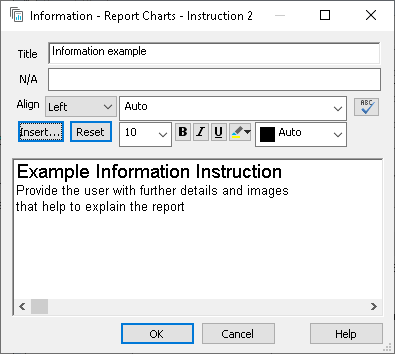
- In Title enter a name for the Instruction.
- In the N/A enter a condition where the Information is not shown in the report.
- Enter text in the contents box.
- Click Insert to add an image, variable field, survey field, date or time, HTML field or cell value.
- Click Reset to set the font settings back to the defaults.
- Click OK to save the Information.
Text Grid
Add a grid table, containing words or images, to a report using the Text Grid Instruction. This can be used to create recommendations dynamically.
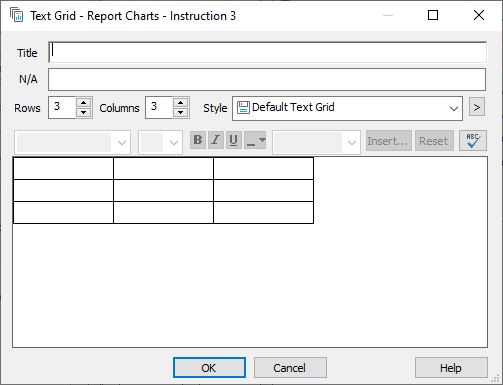
- In Title enter a name for the Instruction.
- In N/A enter a condition where the Text Grid is not shown in the report.
- Adjust the size of the grid in Rows and Columns.
- Select Style to change the look of the Text Grid.
-
Click
 and select Edit Styles to change the Text Grid style and Sizing to change the column sizing.
- In each grid cell enter text or click Insert to add an image, variable field, survey field, date or time, HTML field or cell value.
- Click Reset to set the font settings back to the defaults.
- Click OK to save the Text Grid.