Max Diff
A Max Diff question presents a series of small groups of items, chosen from a larger list, and asks participants to choose the best and worst options.
This helps you find out what your participants think are the most important aspects from the given choices. Common uses of Max Diff questions are determining the top product features users want to purchase, or finding out what will make the biggest impact on customer service improvement.
Build the Max Diff question
Start by defining the aspects of your organisation that you would like to improve.
When you have finalised the list, create a grid question that contains these items or aspects, and add two choices, such as, most important and least important, or favourite and least favourite.
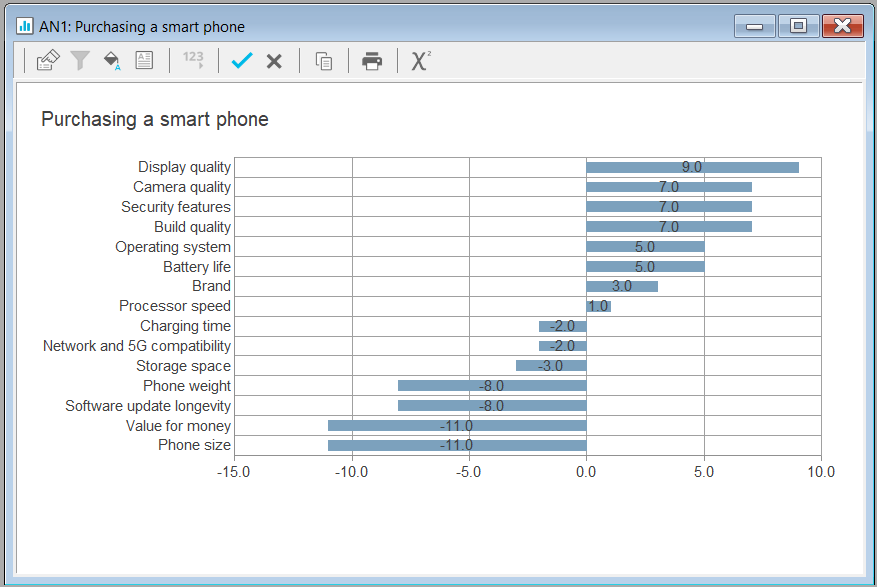
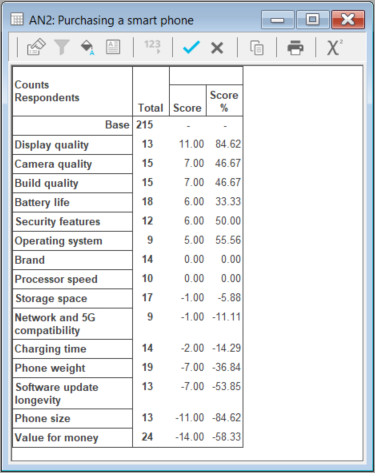
For example, asking people about what is important when purchasing a smart phone.
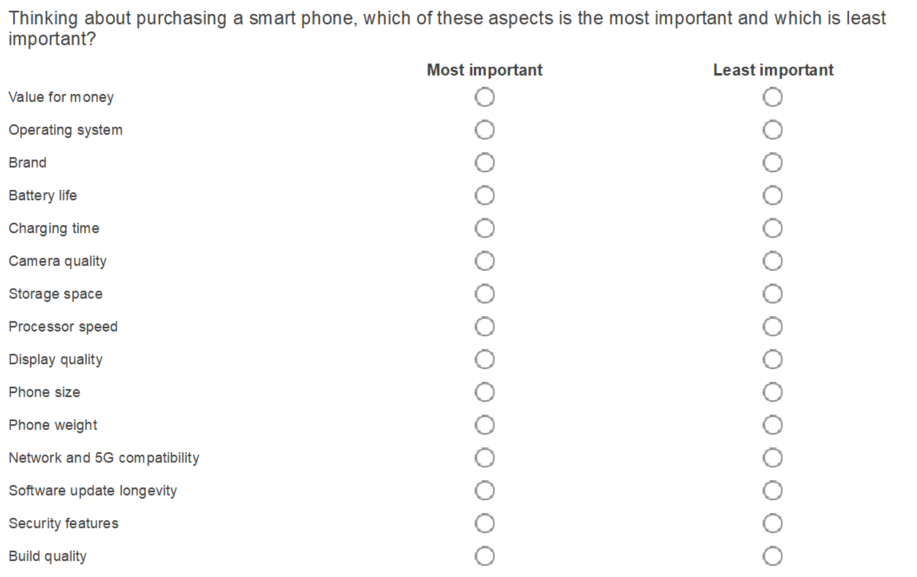
The long list of items in the grid is split into multiple sets, each containing a subset of the items. For each set presented, the participant is forced to make trade-offs when ranking the priority of the items. This differs from a rating question where the participant may select all items as high priority.
Change the settings
The MaxDiff settings allow you to set the number of items in a set and the number of times each item appears. These 2 settings determine how many sets the participants will be asked.
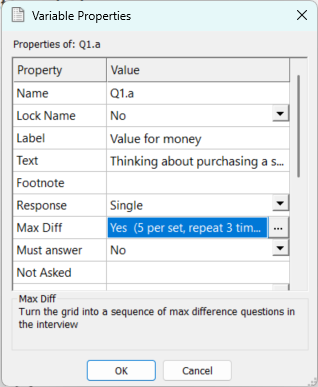
- Select the Grid question.
- Select Variable Properties
 from the Questionnaire Design toolbar.
 - In the Max Diff property, select the three dots. This opens the MaxDiff settings.
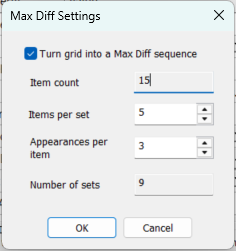
- The Max Diff settings:
- Select the Turn grid into a Max Diff sequence checkbox to create a MaxDiff question.
- Item count displays the number of grid rows. This is read-only.
- In Items per set, enter the number of items or rows to show in each Max Diff question set. This ranges from the minimum value 1 to the maximum of one less than the Item count.
- In Appearances per item, enter the number of times that each item should appear in the Max Diff question set. This ranges from the minimum value 1 to the maximum of one less than the Item count multiplied by 10.
- The Number of sets shows the number of questions that the participants will be asked during an interview. This number is calculated as you change the values of Items per set and Appearance per item. A higher number of sets results in stronger, more reliable individual-level utility scores but must not be set too high to cause participant disengagement.
- Click OK to save the settings.
Carousel and MaxDiff compatibility
The Carousel option is not available with a MaxDiff question. If a question includes both options, then publishing the questionnaire disables the Carousel option while keeping the MaxDiff option.
Max Diff during the interview
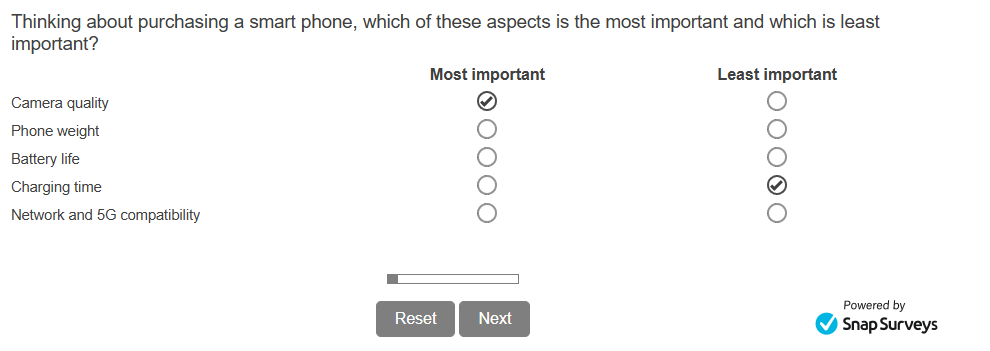
During the interview the Max Diff grid question is presented as a set of similar grid questions with different groups of items.
One set is shown at a time, with the participant moving to the next page to answer the subsequent set. When the participant has answered all the sets in the Max Diff question, they will move to the following question.
Analyse the data
Analyse the responses to the Max Diff question using tables and charts, with the Max Diff chart styles provided.
MaxDiff scoring
When you analyse the response, you will need to include Score and Score % on the Summary Statistics tab. The Score calculation uses the number of times that the participant selects the item as the most or least important. The most important item scores +1 and the least important item scores -1, with unselected items scoring 0.
The MaxDiff weight provides the scoring values. Open the list of weights using the Weights icon ![]() on the main toolbar. Then open the MaxDiff weight to view the weight details.
on the main toolbar. Then open the MaxDiff weight to view the weight details.
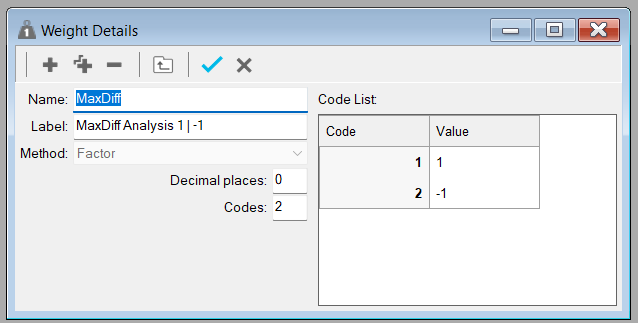
The Score % calculation is the percentage of (the Score divided by the number of times the item appeared).
Create a MaxDiff chart
- Select the Analysis Chart
 icon from the main toolbar to open the Analysis Definition
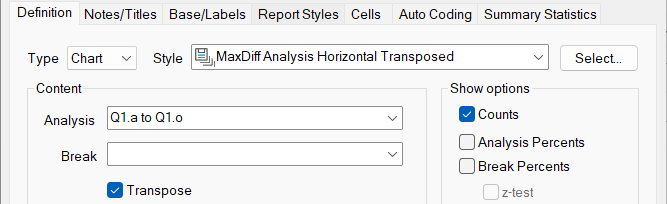
 - In the Definition tab, select one of the MaxDiff chart styles.
- In Analysis, enter the range of MaxDiff grid rows.
- Select Transpose to display the item description.
- In Order by, select Score to order by score.
- In the Notes/Titles tab, enter a title for the chart.
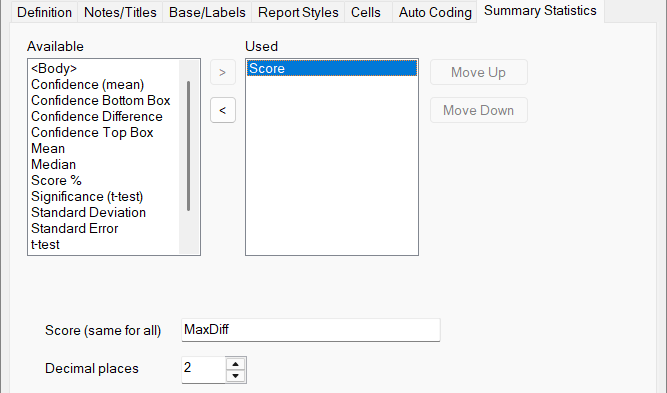
- In the Summary Statistics tab, select the Score or Score % and enter the MaxDiff weight.
- Click Apply to update the chart, and OK to save the changes.
Create a MaxDiff table
- Select the Analysis Table
 icon from the main toolbar to open the Analysis Definition.
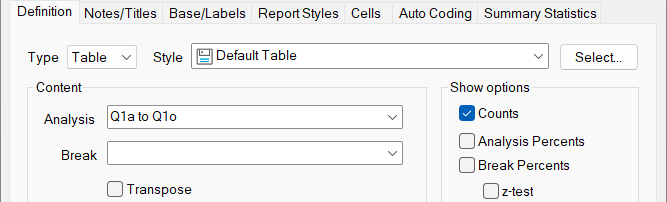
 - In the Definition tab, select the table style.
- In Analysis, enter the range of MaxDiff grid rows.
- In Order by, select Score to order by score.
- In the Notes/Titles tab, enter a title for the table.
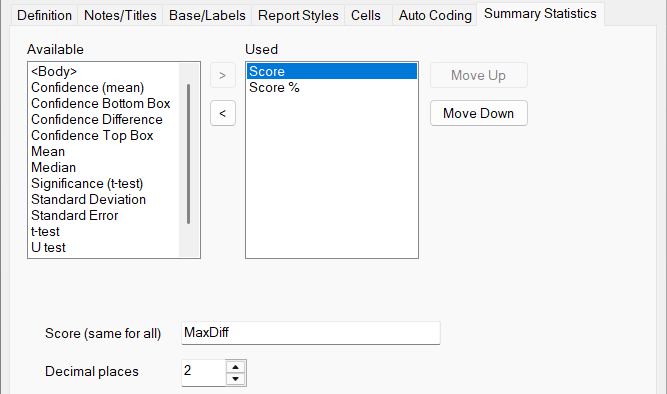
- In the Summary Statistics tab, select the Score and/or Score % and enter the MaxDiff weight.
- Click Apply to update the table, and OK to save the changes.
Using the analysis results
Turn feedback into results that focus on customer driven priority list. The responses can help plan business objectives and focus on the changes that will produce the best results.