Using scores to analyse satisfaction questions
The purpose of many surveys is to discover how satisfied customers are with the product or service they are using. Questions about customer satisfaction are often set up to ask participants to rate something on a rating scale. These ratings can be converted into mean values by analysing the responses using a score, providing useful information that summarises the satisfaction value of all the responses.
Scores allow you to assign a value to each question code, and then calculate analyses using the score instead of the code. This is generally used for scoring satisfaction surveys, so that positive ratings are given positive values and negative ratings are given negative values. You can then summarise the whole satisfaction by calculating the mean of all the cases, showing whether participants are generally satisfied or not, the higher the mean is, the higher the satisfaction score.
When the satisfaction question includes a “Don’t know”, “OK”, “Prefer not to say” or similar neutral answer then these can be treated in different ways in the analysis. A neutral response can be included in the analysis and assigned a value of zero or it can be discarded and not included in the analysis. This produces different calculations for the mean values.
For example, if you have five participants to a survey, who have given the following satisfaction values (from a range of -2 to +2).
Participant 1: -1
Participant 2: +1
Participant 3: +2
Participant 4: +2
Participant 5: Don’t know
To calculate the mean, you sum the values and divide by the number of cases.
- Calculating the mean scoring “Don’t know” as 0 gives the mean as (-1 + 1 + 2 + 2 + 0) / 5 = 4/5 or 0.8
- Calculating the mean discarding the “Don’t Know” response gives the mean as (-1 + 1 + 2 + 2)/4 = 4/4 or 1.
It is important to decide how to treat neutral values when judging the satisfaction of your participants. By using a score you can choose to score them as a neutral value, or discard them from the calculation.
This tutorial shows how to create a score to analyse the satisfaction values in the Crocodile Rock Cafe survey that is supplied with Snap XMP Desktop. It shows both the effect of scoring neutral responses as zero, and the effect of discarding the neutral responses.
Step 1: Creating the score weight
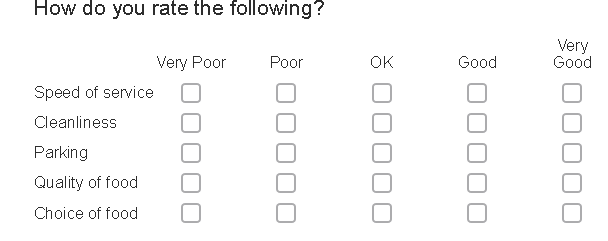
The Crocodile Rock Cafe survey that is supplied with Snap XMP Desktop contains a rating question that asks participants to rate how satisfied they are with aspects of the service.
The questions to be scored are Q6a to Q6e.
- Click Survey Overview
 on the Snap XMP Desktop toolbar to open the Survey Overview window then click Offline Surveys.
 - Open the Crocodile Rock Cafe survey and move to Q6 How do you rate the following?
- Click Variables
 on the Snap XMP Desktop toolbar. This opens the Variables window.
 -
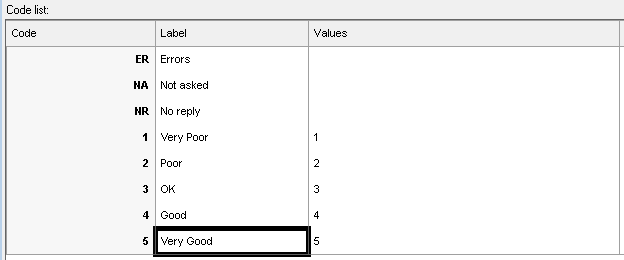
Select Q6a then click Properties
 . This opens the Variable Details window where you can view the Code list showing the label assigned to each code.
- Click Weights
 on the Snap XMP Desktop toolbar. This opens the Weights window.
 - Click New Weight
 to create a new weight. A weight is a way of matching values to codes for analysis.
 - Enter the following values for the new weight:
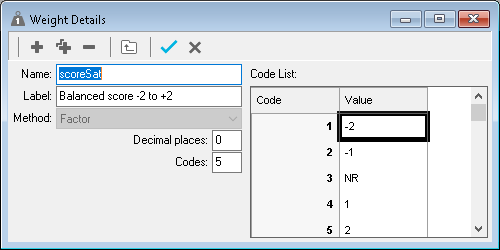
- Name: scoreSat
- Label: Balanced score -2 to +2
- In Code List, enter the values for each code. NR is used when the response is OK or code 3 in the example. This discards any responses that have a value of NR and these are not included in the analysis..
-
Click Save
 to save the weight.
Step 2: Using the score in an analysis
- Click Analysis Table
 on the Snap XMP Desktop toolbar. This opens the Analysis Definition window to create a new table.
 - In Analysis, enter the value Q6a ~Q6e (this includes all questions from Q6a to Q6e).
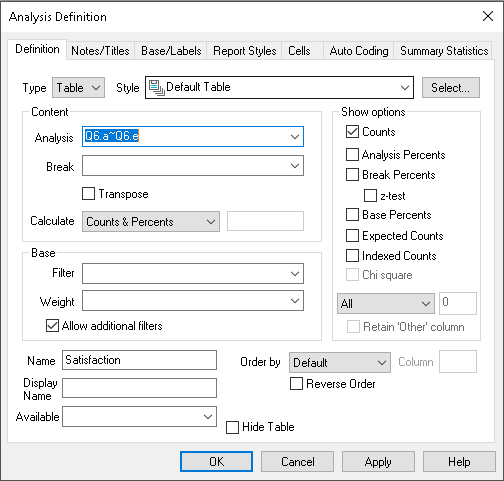
- In Calculate, check that Counts and Percents is selected.
- In Name, enter Satisfaction in order to identify it easily.
- Select the Summary Statistics tab. In Score, enter the name of your score, scoreSat. This score is used to create a summary of the analysis, scoring the codes with the specified values.
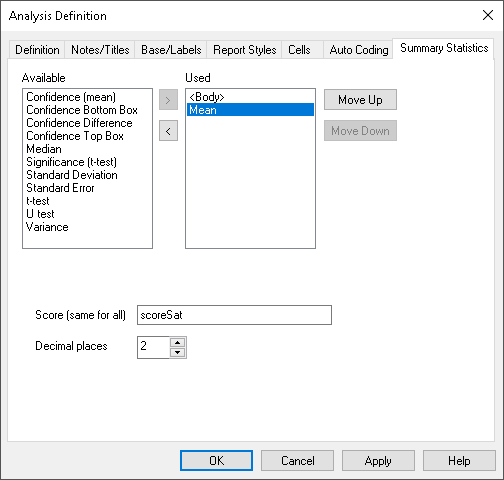
- Click on Mean on the left side in the Available column and move it to the Used column to display the mean.
- Click OK to display the table.
- There is a column displaying the mean scored values.
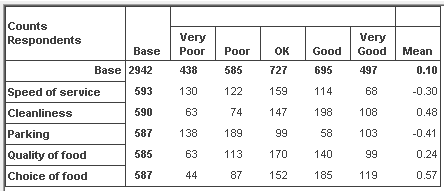
The top line labelled Base shows the total number of all participants for all the questions. The mean satisfaction of everyone with all the services is 0.10.The other rows show the average satisfaction for each service. You can see that people are generally positive about the Cleanliness and the Choice of food and unhappy about the Parking and Speed of service.
Step 3: Showing the effect of including and excluding neutral responses
You can examine the effects of including the neutral responses as zeroes by changing the score.
-
Click Weights
 to open the Weights window.
- Double-click the weight scoreSat to open the Weight Details window.
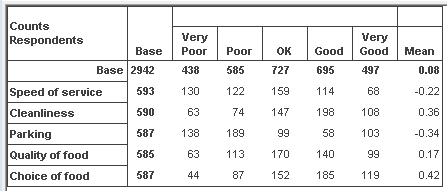
- Edit the neutral score in the list, changing it from NR to 0.

- Select the Analysis display window for the table. The Rebuild button is now enabled, as the score has changed since the analysis was performed.
- Click Rebuild to recalculate the analysis and show the updated mean values.
-
Click
 to save the changes.
If there is a topic you would like a tutorial on, email to snapideas@snapsurveys.com