Using filters to find a subset of response data
Filters allow you to view a subset of the response data that meets specific criteria. This makes it easier to analyse specific areas in the survey’s responses. The response data is not deleted; you are shown only the response data that matches the criteria. The criteria can be changed to provide a different subset to view.
Snap XMP Desktop provides filters that are available in a number of areas.
- viewing responses in the Data Entry and Questionnaire windows
- adding a filter to an analysis in the Analysis Definition window
- adding a filter to a report in the Report window
- adding a filter to certain types of report instruction
- creating external filters for use in reports, analyses and shared users in Snap Online
In the same way, you can filter the response data.
You can filter data by:
- the answers to one or more of the questions
- participants who did or did not reply to certain questions, for example, selecting all participants who wrote a comment
- value of a question response or on system data provided by Snap XMP Desktop
The way you filter may be different depending on the type of question.
- filter multi-response values on which codes or how many codes a participant has selected
- filter quantity questions by whether the value is larger, smaller, or equal to another value
- filter by the date or time, or on parts of them such as month, day or hour
- filter text questions on whether the text has been entered, or whether it contains particular words or parts of words
- filter cases by case number
You can also combine filters together using logic operators, such as AND, or use a derived variable to create complex filters.
Filtering responses in a chart showing satisfaction ratings
This example shows how to create a chart showing the satisfaction rating before and after a promotion by applying a filter to analyse the data over different months. The sample survey Crocodile Rock Cafe is used for this example.
- Click on Analysis Chart
 on the Snap XMP Desktop toolbar. This opens the Analysis Definition window for a chart.
 - In Style, select Horizontal Stacked Bar Counts Transposed. This creates a bar chart showing the proportions of people who selected each response.
- In Analysis, enter Q6.a TO Q6.e. This grid question shows the different levels of satisfaction with different aspects of the service.
- Select Transpose to display the responses by question rather than by value.
- In Filter, enter Q1a MONTH=(7 OR 8). This filter uses Q1a which is a question asking the date that the participant visited. MONTH is a date function which returns the month of a date.
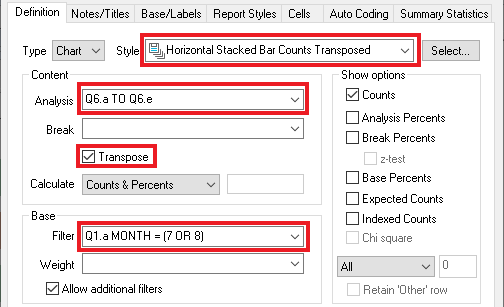
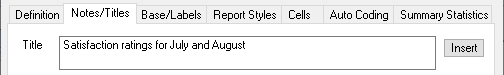
- Click the Notes/Titles tab and enter a title such as Satisfaction ratings for July and August.
- Click OK to create the chart. It will look something like this:
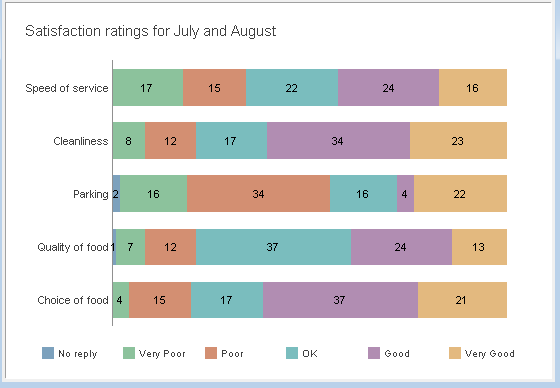
-
Click Save
 on the chart toolbar to save your chart.
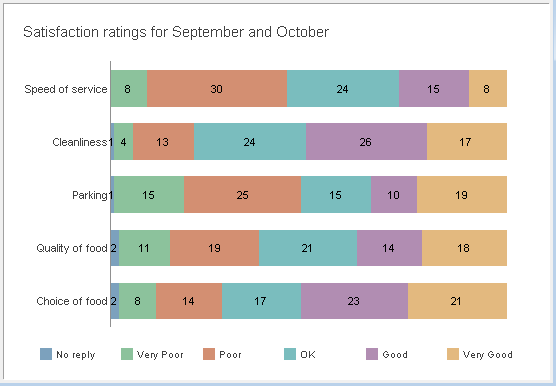
- The filter can be changed to different months and the chart can be updated with the new results for comparisons.
- Entering a filter for the months September and October, Q1a MONTH=(9 OR 10), produces a new set of result where you can see that the levels of satisfaction have improved.
Creating a list of comments
This example creates a list of comments, together with the demographics of the participant making the comment. In this situation, only the responses that contain comments are needed. These can be identified by using OK in the filter. Note that you can use capital or lower case letters for question numbers in the Analysis and Break fields.
- Click Analysis List
 on the Snap XMP Desktop toolbar. This opens the Analysis Definition window for a list.
 - In Analysis, enter the questions or variables that will be shown in the list. In this example, enter case, Q9, Q12, Q11 in the Analysis field. The list will show the case number, comment, gender and age of the participant.
- In Filter, enter Q9 OK. This filters the responses where a comment has been entered. (You could also use NOT Q9 NR to specify cases which do not have a “No reply” to Q9.)
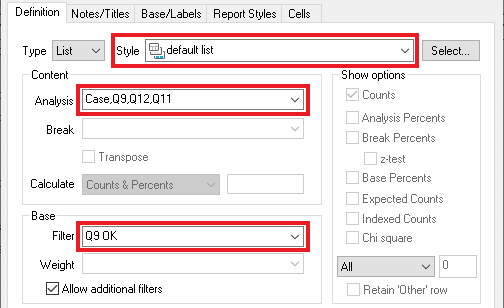
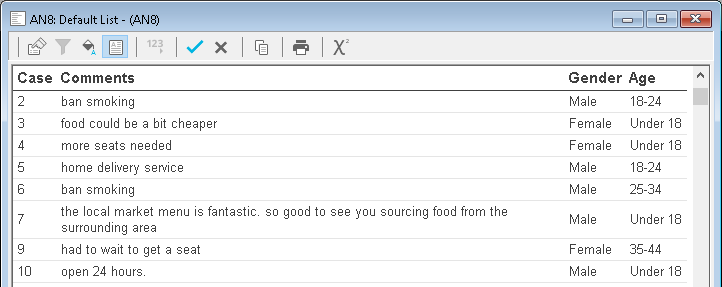
- Click OK. The list is displayed. You can see from the case numbers that responses without a comment have been omitted.
Further information can be found at Filtering the data responses and Filter expressions.
If there is a topic you would like a tutorial on, email to snapideas@snapsurveys.com