Using the Chart Designer
Once you have set up the chart in the Analysis Definition dialog, you can start the Chart Designer by clicking the Edit Style button
![]() in the toolbar of the Analysis Display window.
in the toolbar of the Analysis Display window.
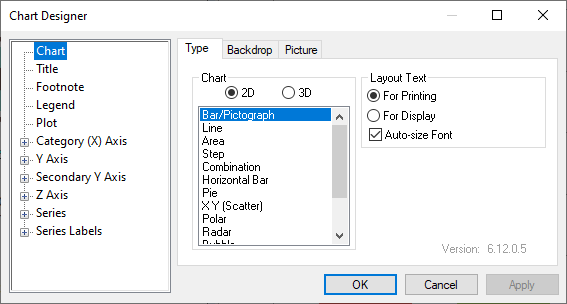
The chart elements are listed on the left hand panel in the Chart Designer. Selecting a chart element displays tabs that allow you to change different aspects of that element. Some of the chart elements have sub-elements that can be accessed by clicking on the
![]() symbol.
symbol.
- Click the Edit Style button
 in the toolbar of the Analysis Display window or double click on the item you wish to change. The Chart Designer opens on the Chart or the double clicked item.
 - As you make changes to the chart elements click on Apply to see the effect they make. Once you have clicked Apply the Cancel button will not reset the changes. You can cancel the changes once you return to the Analysis Display window using the
 icon.
icon. - To abandon your changes, as long as you have not clicked on Apply, click on Cancel.
- To confirm your changes, click on OK.
Adding a background to your chart
-
Click the Edit Style button
 or double-click the background of the chart to open the Chart Designer.
- Select Chart in the left hand column if it is not already selected.
- Select the Picture tab.
- Click the Browse button to choose your picture. An open file dialog appears.
- Select the image you want as the chart background and click Open.
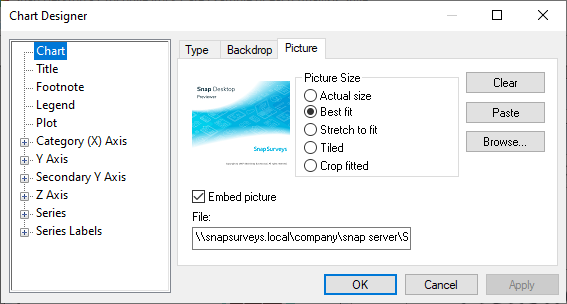
- Set the Picture Size radio button to one of the options. The default is set to Best fit.
- Click Apply. The Chart Designer dialog will remain open, but the new background will appear on your chart.
Setting the color of a pie-slice or bar
- If the chart designer dialog is not already open, double-click the pie slice or bar that you wish to change on your chart. If it is already open, select the item you want in Series | Your slice or bar label | Datapoint default | Datapoint 1 in the left hand pane.
- Select the Fill tab.
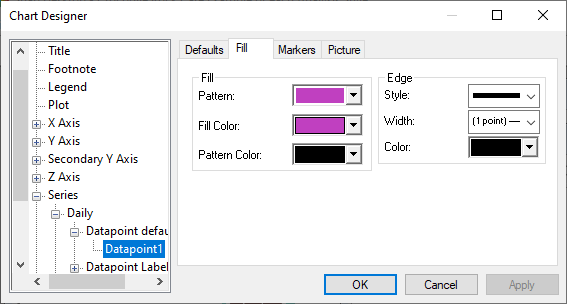
- Here you can change the Pattern, Fill Color and Pattern Color. The Edge style can also be changed. Click Apply to see your changes on the chart.
- Select the Datapoint for the next bar/slice in the Series in the left hand pane and repeat the process.
- Click Apply if you wish to make further changes, else click OK to close the dialog.
Tips for chart design
- When making changes to font style and size, aim to make consistent changes across all aspects of the chart for more professional and easier to read documents.
- To insert a line break in your text use Crtl + Enter.
- You can only show both absolute values and percentages in the pie and doughnut chart styles. On a pie or doughnut chart the percentage shown will always be the Break Percentage.
- If you wish to show percentages on chart styles other than pie or doughnut, you must choose a percentage option in the Analysis Definition dialog. The value displayed will be the percentage selected without a percentage sign.
- There are some chart styles which already have data point labels built in.
- An alternative method of accessing the Series option for a particular code is to use the mouse. Click once to highlight a bar or segment of the chart, and then double click to bring up the dialog box. Do not move the mouse as you undertake this operation or it will not work.