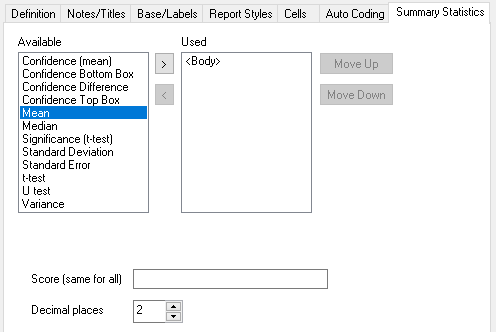
Summary Statistics tab
|
Area |
Description |
|
Available |
List of statistical data you can add to your chart/table |
|
Used |
List of statistical data you have added to your chart/table |
|
Statistical data |
|
|
<Body> |
The analysis/break information given in definition |
|
Confidence (mean) |
Specify the confidence level and display the confidence interval level for the mean (using the defined scoring system) |
|
Confidence Bottom Box |
Specify a low-end group of values to be calculated and displayed. If confidence interval selected as an option, display the level of confidence that sample matches target population. |
|
Confidence Difference |
Display (top box percentage total) – (bottom box percentage total) |
|
Confidence Top Box |
Specify a high-end group of values to be calculated and displayed. If confidence interval selected as an option, display the level of confidence that sample matches target population. |
|
Mean |
Average value of the analysis variable(total divided by base) using the defined scoring system |
|
Median |
Central value (equal number of cases to each side |
|
Significance (t-test) |
Compare mean scores of columns with mean scores of the base to distinguish whether or not the difference between the groups’ averages would most likely reflect a “real” difference in the population from which the groups were sampled. The significance is shown as a percentage. |
|
Standard Deviation |
Display standard deviation (measure of dispersal of values and hence deviation from mean) |
|
Standard Error |
Display standard error (indication of how far individual scores deviate from the mean score) |
|
t-test |
Compare mean scores of axis-defined groups to see if difference is significant. Display significance letters by column values |
|
U test |
Compare median scores of axis-defined groups to see if difference is significant. Display significance letters by column values |
|
Variance |
Display variance (measure of dispersion of values in a distribution) |
This table shows the meaning of the options which appear when a given statistic is selected. These options specify how the statistic is calculated and displayed. The default options are set in the Analysis tailoring dialog.
|
Statistic |
Option |
Meaning |
|
Mean Standard Error Standard Deviation Variance Median |
Score |
Name of weight matrix, calculation, or name of variable to apply |
|
|
Decimal places |
Number of decimal places used in calculation |
|
Confidence (mean) |
Confidence Level |
The level of certainty that the answer lies within the range given |
|
Confidence Top Box Confidence Bottom Box |
Use the x y responses out of z to calculate q |
Select the range of responses used to calculate the confidence top or bottom box. These will be the high-end responses for the top box and the low-end responses for the bottom box |
|
|
Ordered values |
Check to only use displayed (ordered) values in calculation and omit any suppressed zero values |
|
|
at a confidence level of |
(gap between sample and population) at the specified confidence level |
|
|
Show confidence intervals |
Check to display the confidence interval results |
|
|
z-test |
Check to display the z-test results with the confidence intervals |
|
|
Multiplier |
Allows you to modify the confidence interval if the sample is weighted or drawn from a small (or finite ) population. Set to sqrt(1-n/N) where n = sample size and N = population |
|
Significance (t-test) |
Comparison |
Base used when comparing the mean of base to the mean of each category on your table. Either use: Base: the mean for all respondents Base less current: the mean for respondents that are not included in the category being compared. |
|
|
Score |
Name of weight matrix, calculation, or name of variable to apply (same as that used for Mean, Standard Error, Standard Deviation, Variance, Median) |
|
|
Decimal places |
Number of decimal places used in calculation |
|
t-test U test |
Upper Level |
Set the upper significance level |
|
|
Lower Level |
Set the lower significance level |
|
|
Labels: Grouped |
Specify how the figures are shown for tables with more than one break variable |
|
|
Show: All |
Select whether result is shown in both columns it affects, or whether it is only shown in one column. The column it is shown in may be: column with the higher/lower value column in the left-most/right-most position |
|
|
Show: Hyphen |
Check to show hyphens for non-significant results Check to label columns with the letter used as index |
|
|
1-Tail |
Select type of test (crudely, 1-tailed when looking for increase/decrease between results;2-tailed when looking for difference between two mean scores) |
|
|
Apply Tukey’s Correction (t-test only) |
Apply Tukey’s Honestly Significant Difference (HSD) correction to take account of carrying out multiple t-tests |
|
|
Results exclude the x y codes (U test only) |
Enables you to exclude codes (eg, Don’t Know ) from the calculation |