Statistical significance in tables (z-test)
The z-test is used to compare two percentage scores to see if the difference between them is statistically significant.
This means: Is the difference in percentage scores in the table purely a result of the sample used, or does it indicate a real difference in percentages in the target population?
For each row in a table it compares the Break Percent for each column with all other columns. If more than one variable is included in the Break specification, the comparison will be among columns for the same variable only. That is, if “Age” and “Gender” are specified as separate break variables, the individual columns within the age variable will only be compared with other columns for “Age” and not with the columns for “Gender”.

Each cell of the table will contain the Break percent and a series of letters and hyphens. This is the output of the z-test and indicates which differences are significant and which are not significant, at the specified confidence levels.
The three possible characters and their meanings are:
- A hyphen, meaning the difference is not statistically significant
- A lower case letter indicating that the difference is statistically significant at the lower level specified
- An upper case letter indicating that the difference is significant at the higher level specified.
The letters and hyphens refer, in order, to the other columns within the variable (A refers to the first column, B to the second column and so on).
Example: Adding the z-test to a table in the Crocodile survey
-
Click
 on the Snap toolbar to build a table
- Enter Q4 (Items ordered) in the Analysis field.
- Enter Q11 (Age) in the Break field.
- Check the Break Percents and z-test boxes on the right hand side. All other options should be clear.
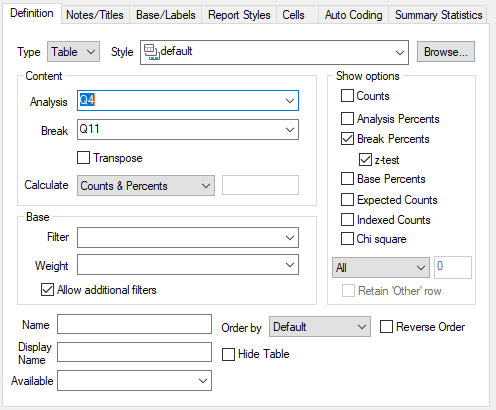
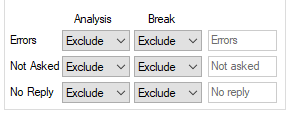
- Click the Base/Labels tab. Confirm that any missing values are excluded.
- Click the Cells tab.
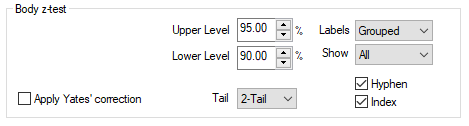
- In the Body z-test section:
- Set the Upper Level to 95% and the Lower Level to 90%
- Select 2-Tail.
- Select All in the Show box.
- Check Hyphen and Index if these options are not already selected.
- Clear the Apply Yates Correction box.
- Click OK to create the table.
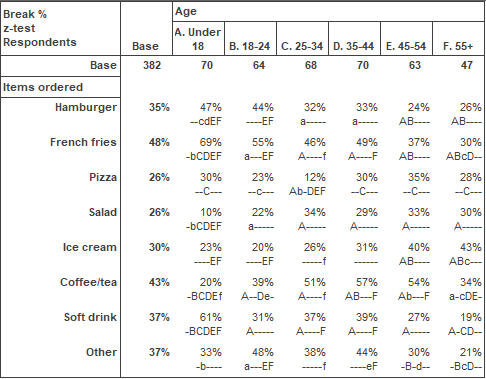
If you look at the cell for the row labelled “Coffee/Tea” and the column labelled “C. 25-34” the Z-Test output shows “Ab‑‑-”. This indicates that the differences between this column (C) and column A is significant at the upper level (upper case letters), the difference between this column and column B is significant at the lower level (lower case letters) but the differences between this column and the columns D,E and F are not significant (hyphens). Note that there must be at least one hyphen in the output as a column cannot be significantly different from itself.