Setting the options for Significance (t-test)
You can control the way t-tests and U-tests are calculated by changing the figures in the Summary Statistics tab of the Analysis Definition dialog.
If you want these figures to be the default values for the survey, you must set them in the Analysis tailoring dialog. This also has a Summary Statistics tab. You open the Analysis Tailoring dialog by selecting Analysis from the Tailor menu.
- Open the appropriate dialog (Analysis Definition or Analysis tailoring)
- Click the Summary Statistics tab
- Select the Significance (t-test) in either of the columns. The possible options appear below.
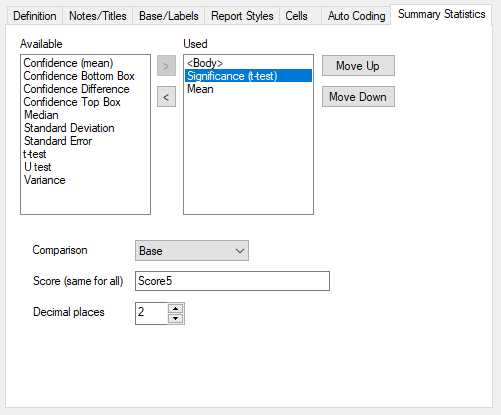
- Comparison enables you to select the base used when comparing the mean of base to the mean of each category on your table. Either use:
- Base: the mean for all respondents
- Base less current: the mean for respondents that are not included in the category being compared.
- Score is the score applied for all calculations
- Decimal places give the number of decimal places the significance (t-test) value is calculated to. (It is usual to keep the significance (t-test) decimal places to 0 and the mean decimal places to 2.)