Printing response data with the questionnaire
The Data View mode in the Questionnaire window allows you to view and print responses to the survey in the questionnaire. The responses can be viewed either as a summary showing counts and/or percentages or as responses from individual participants. You can print a list of survey results when there are survey responses available, either when the survey is live or after it closes.
The Questionnaire window is changed to Data View mode by clicking ![]() on the Questionnaire window toolbar. This shows the case data in questionnaire format. There are two options available:
on the Questionnaire window toolbar. This shows the case data in questionnaire format. There are two options available:
- Select Case Data to view or print individual responses
- Select Counts to view or print a summary of responses
Printing a summary of responses
- Click the
 button in the Questionnaire window to switch to the Data View Mode.
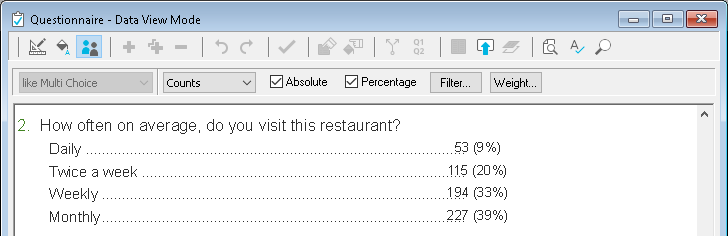
 - Select Counts from the drop down in the Questionnaire toolbar.
- Check the Percentage box to show the percentage of participants giving each answer. For example, 9% of visitors ate at the restaurant every day.
- Select the Absolute check box to show the number of respondents giving each answer.
- There are options to apply
- a filter to limit the number of responses
- a pre-defined weight to use weighted response data
- Click Print Preview
 to preview and then print the report.
Printing the individual responses
- Click the
 button in the Questionnaire window to switch to the Data View Mode.
 - Select Case Data.

- Use the slider bar to move between the cases
- Click Print Preview
 to open the Printing Options dialog.
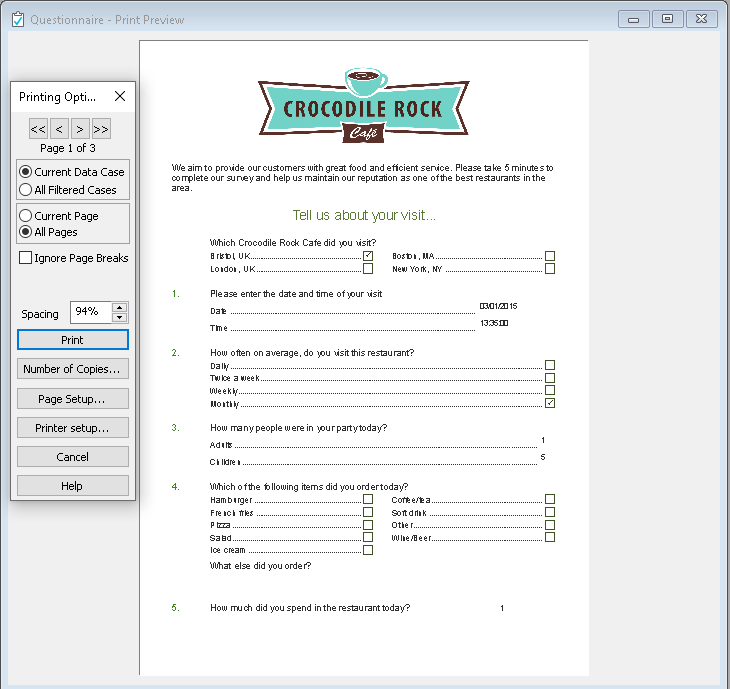
- Select the print option:
- Current Data Case to print the selected case
- All Filtered Cases to print the filtered responses or all responses, if there is no filter
- Current Page to print the selected page of the current cases
- All Pages to print all pages of the current case/all cases (each case will be printed in turn)
- Click Print to print the selected responses.
Limiting the responses
- Click
 on the Questionnaire window toolbar to show the case data in questionnaire format.
 - Click the Filter button on the Questionnaire window toolbar.

- Enter a filter expression to limit the cases that will appear in the report and click OK. A count appears on the screen of the number of cases that match the filter criteria.
- Use the slider bar to move between the cases
- Click Print Preview
 to preview and then print the report.