Introduction to Smart Reporting
A Smart report comprises a series of report instructions which include images, text, analyses, and even other reports. Instructions are the building blocks of Smart Reporting.
An instruction can:
- Set page properties (number of columns, orientation, page numbering etc.)
- Establish contexts (to specialise analyses and texts to a particular viewpoint)
- Execute analyses (charts, tables, response lists, word clouds or analysis maps)
- Show a block of text that can include data from variables or analysis, for example a particular cell value of a table
- Execute another report, or part of another report
- Be included conditionally
The example Smart Report page below has been built from a series of instructions, arranged to produce a part of a larger report.
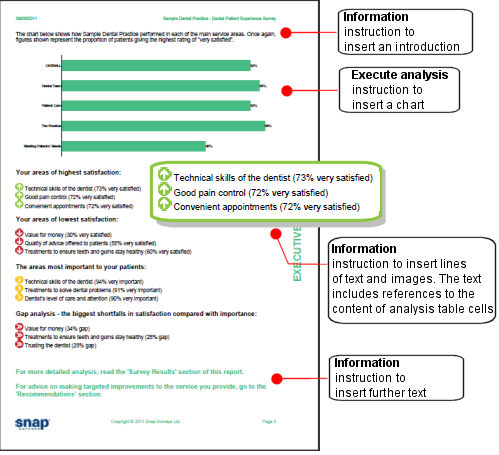
This page is part of an executive summary section. A complete Smart Report will comprise a number of sections, for example, a cover page, demographics, and appendices. When run together, the sections combine to produce a Smart Report.
Report content
A Smart report will commonly include the following:
- Cover page
- Summary
- Benchmarked analysis
- Recommendations
- Literal responses
- Appendix
This section describes how they can be generated.
Executive summary
An executive summary serves two purposes –
- To describe how and why the survey was conducted.
- To give an overview of the results
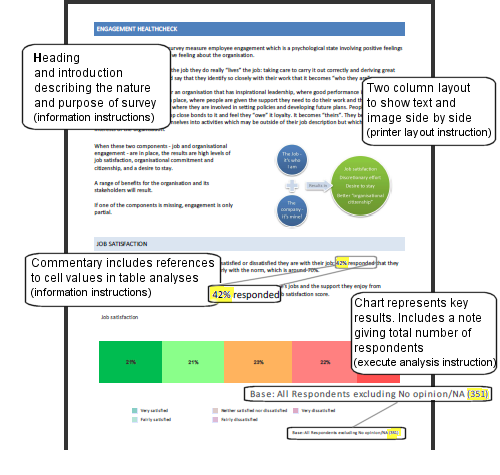
An executive summary will commonly have a chart or benchmark and paragraphs of standard text with cell references to analysis tables throughout.
Static benchmarks
A static benchmark allows survey results to be presented with reference to previously recorded data. Static benchmarking is most useful where:
- A comparison with published industry figures is required
- Summary figures exist but the raw data is not accessible
This example Smart Report page shows charts including benchmark data.
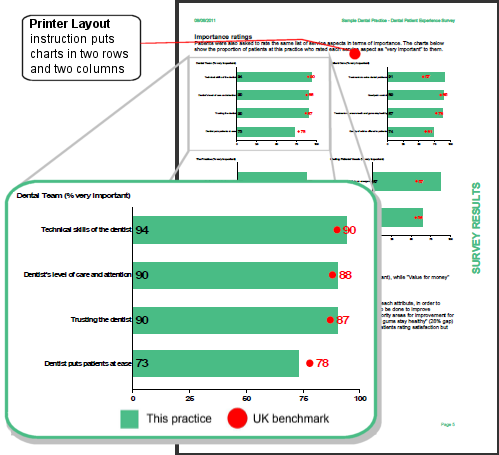
Using a static survey-wide figure in a chart
Analysis takes place using case data. If you wish to use a static (non-case data) figure such as a benchmark in a survey, you can do so by adding it to a table analysis and converting the table to a chart. Set up a derived variable which is true for all cases. This provides a place to store the data so it can be used in charts.
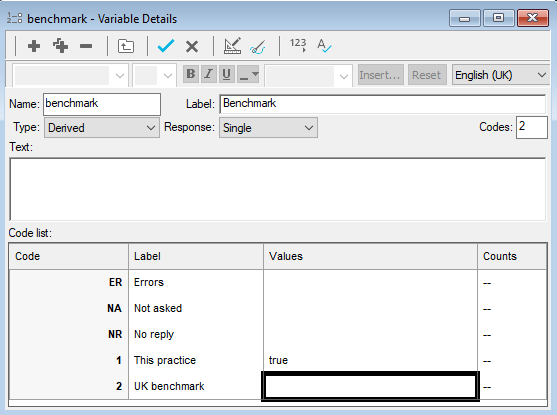
Use the derived variable in a cross tabulation analysis, and overtype the empty values in the table cells with benchmark data.
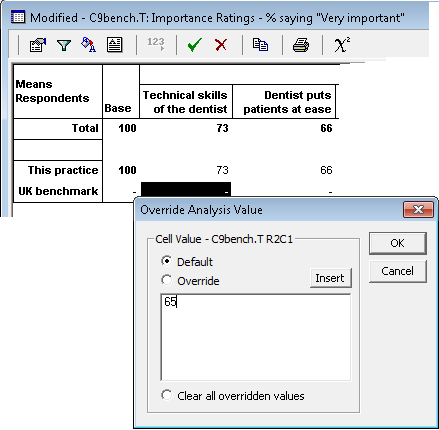
Convert the overtyped table to a chart (as above example) or an analysis map. The overtyped data will be used to draw the chart.
Identifying most / least positive results for the commentary and recommendations
Smart reports often have commentaries which refer to the most positive or least positive results.
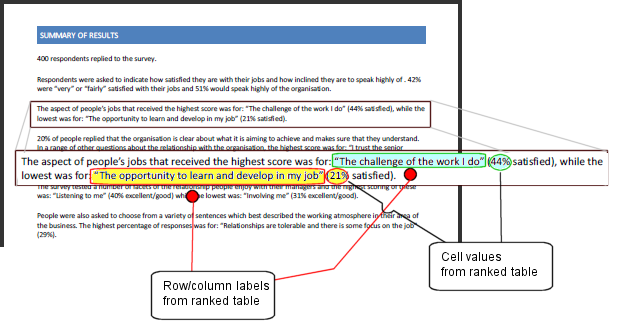
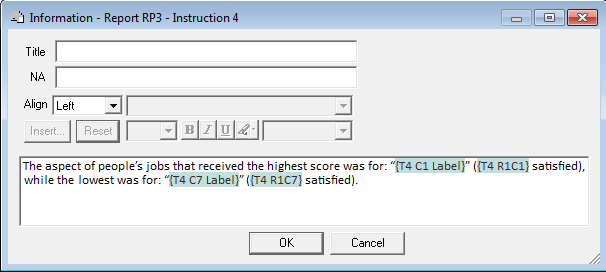
In the above example, an information instruction includes permanent text and a number of dynamic fields, drawing cell values and row/column labels from a ranked table into the Smart Report.
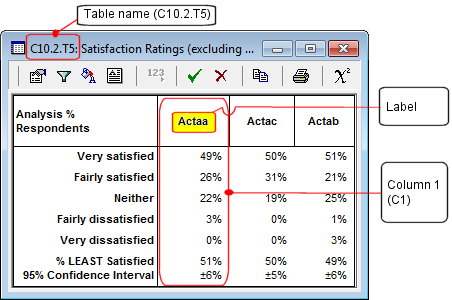
The ranked table below is the source for dynamic fields in this example. This table is ordered by % most positive – resulting in the highest scores appearing in the first column.
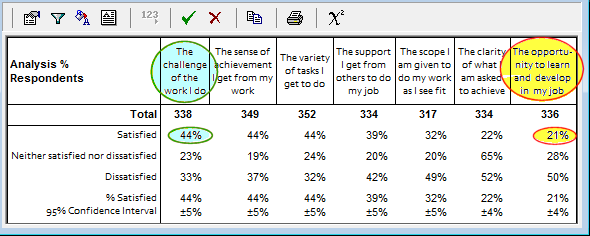
Hints and tips
- If identifying the 3 most or least positive, ensure there are sufficient categories that no item might appear in both lists
- Only the first 3 categories would be picked out, even if the fourth category has the same low score
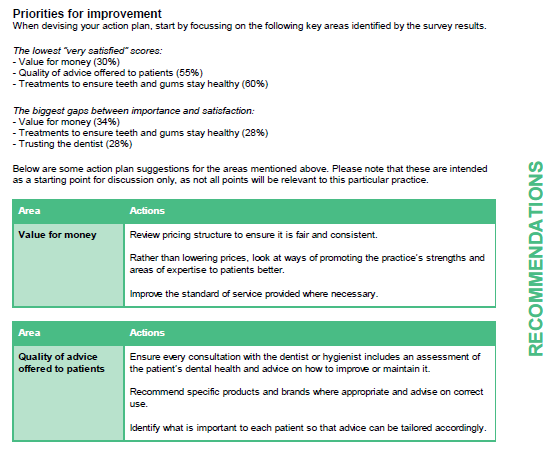
Creating the recommendations dynamically
You can insert different information in a report depending upon positions in a ranked table. This is very useful if a report includes recommendations for improvement for those areas rated as least satisfactory.
For example the report below includes an instruction to execute the instructed found in the label of column one of a specified table.
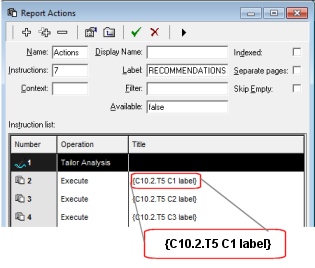
A named report of recommendations has been created for each area that is included in the ranking. The table used to rank the areas has been set up to include the names of the recommendation reports as the column labels.
When Actaa is executed, it includes the appropriate recommendations in the report.
Note that this requires
- Named reports or analyses containing the recommendations (the example uses a text grid to lay out the recommendations)
- Ranked table column labels to be overtyped with the correct table or report name
Creating appendices
Supplementary to the main report, the appendix offers more detail for those who are interested. An appendix will commonly comprise a number of sub sections, including –
- A response summary
- Comments
- Respondent profile
- Sub group analysis
- A copy of the questionnaire
These are easily created using standard analyses such as lists.