Introduction to contexts
When you are creating a Smart Report, you usually want to put the most up-to-date data in the report. This data changes as more responses come in, so you must have a way of representing it that allows it to change when the data changes. You can look at all the survey data or focus on a subset that you are interested in. There are two ways of doing this:
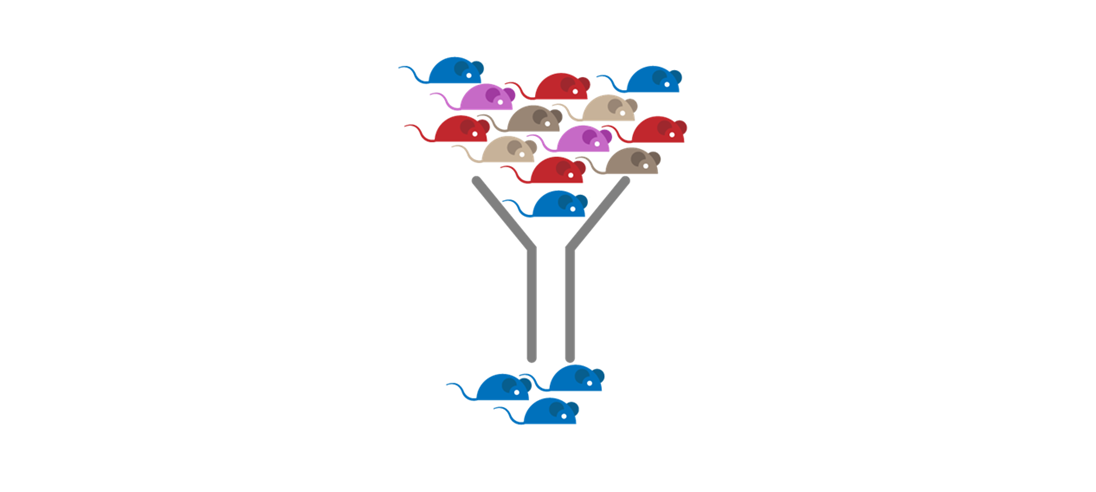
Using a filter
This allows you to select the cases that you are interested in. For example, you might filter your data so you are only looking at the data provided by respondents over 50.
This method is easy to set up, but means that you cannot see data that has been filtered out. For example, you would only be able to analyse the blue mouse data once a blue mouse filter has been applied.
Using a context
This allows you to look at a subset of data in a group of cases which have been tagged with a value in a context variable. You can also access data without that tag value, so you can compare the tagged subset with all data.
For example, if your context variable was “mouse colour”, you could set the context to “blue”.
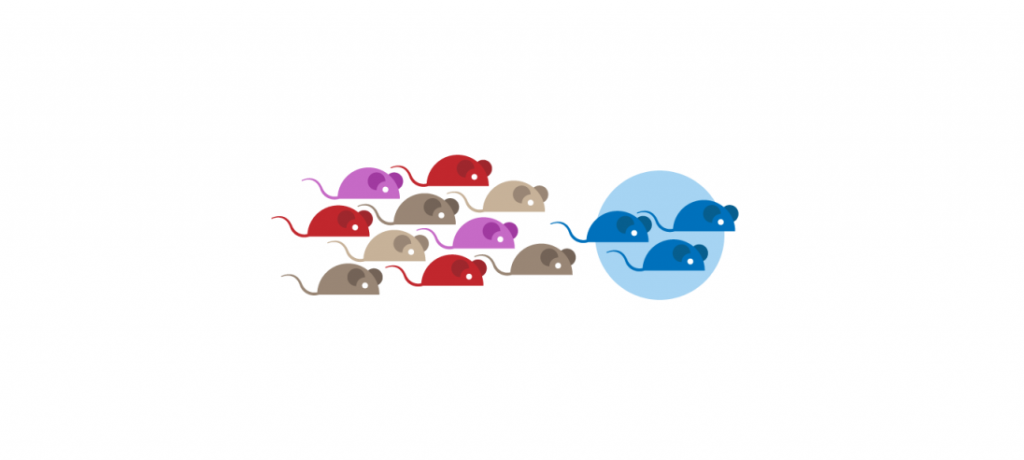
You would be able to analyse the data for mice tagged as blue, but you could also compare the blue mice to the other mice.
The owner of the blue mice could get a personalised report that showed how their mice compared to the average mouse.
By setting the context to red, you can generate a report for the owner of the red mice with the appropriate data for their mice.
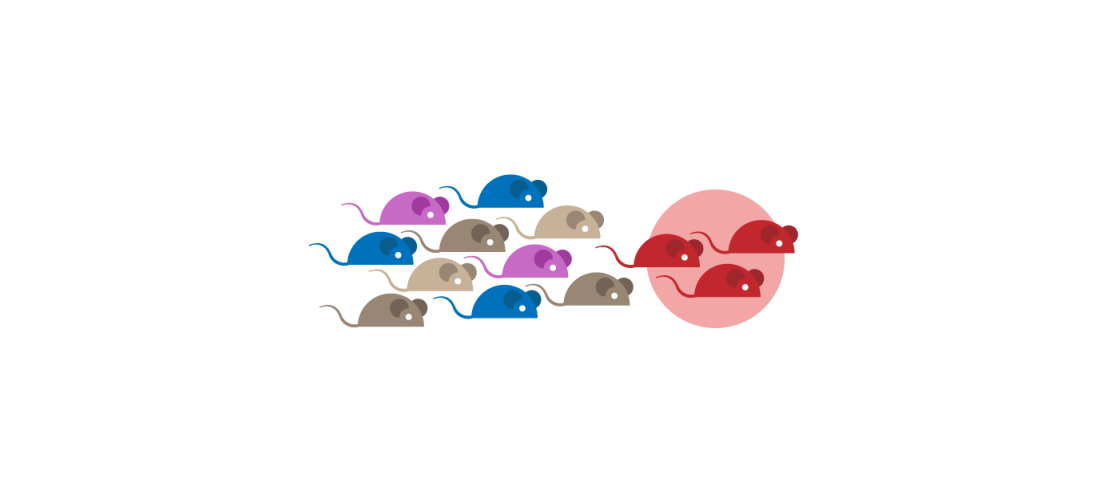
The context does not just work on data. You can associate images, chart labels or report text with the different contexts, so the report look and content will change when you change the context from blue to red.