Introduction to factor analysis
Factor Analysis is a data reduction technique that looks at responses to several variables and summarises them into composite variables, known as factors that make analysing the data a more manageable task. Also called Principal Components Analysis, its main use is in identifying the underlying patterns in the way customers have responded to a series of questions.
Typically, a survey might contain a series of questions asking respondents to express an opinion on different aspects of the product or service being evaluated. There may be dozens of questions that all require a response using, for example, a 7-point rating scale. Spotting trends in such a long list of questions can be difficult, so Factor Analysis is used to reduce the list to one of a more manageable length.
In Snap XMP Desktop, the Factor Analysis technique looks at correlations between each pair of questions and combines variables that have a high correlation with each other. These groups of variables are then combined in a particular way to form the factors. As the resultant factors take into account responses to several different source variables, the original list of variables can be reduced to a more manageable number, with each factor as a form of derived variable.
Typically each factor produced by the analysis will be heavily based on a subset of variables that are in some way similar. Since the resulting factors are stored within Snap and can be used as variables in subsequent analysis, knowing the source variables that have influenced the factor most heavily helps when giving the factors meaningful names.
Since the purpose of Factor Analysis is to reduce the number of variables to a more manageable level, it is likely that only a small number of the factors will be retained. The factors are listed in decreasing order of importance, allowing you to choose how many to retain for further analysis. The first factor will be the one that explains the highest amount of the total variance within the data (for the variables used in the source). The second factor will be the one that explains the highest amount of the remaining variance, and so on. The number of factors to be retained will depend on how many source variables are used, and the data for those source variables. This decision is, to some degree, arbitrary. There are theories that provide guidance on how many factors to take, such as ignoring factors with an Eigenvalue below a certain threshold, or taking sufficient factors to have a cumulative variability proportion of greater than a prescribed level.
An important application of Factor Analysis is as a precursor to Cluster Analysis.
Creating a factor analysis
- Open the survey.
-
Click the
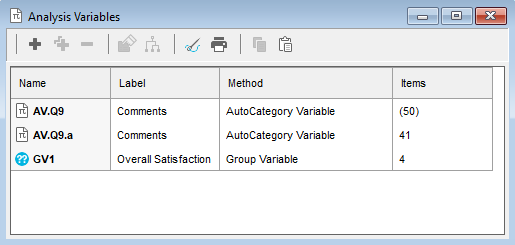
 button on the toolbar to open the Analysis variables window. The overview window shows all the Group variables, Auto-category variables, Factor analyses and Cluster analyses set up in the current survey.
-
Click the
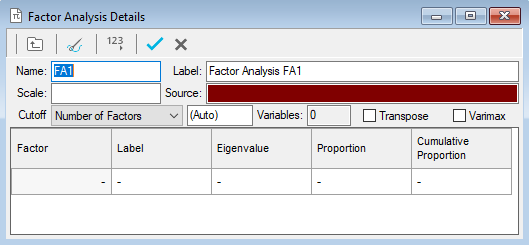
 button and select New Factor Analysis from the menu. This opens the Factor Analysis Details window.
- Provide a suitable name and descriptive label of the factor analysis.
- In the Source field specify the list of variables for which factors are to be derived. Use range definitions if the variables fall into a consecutive range, for example Q6a to Q6e includes all variables between and including Q6a and Q6e. Specify Q6a to Q6e in the Source field. Separate variables with commas if they do not fall into a consecutive range, e.g. specifying Q6a, Q6b, Q6d.
- Once the source variables have been specified, click in the table below and the factors will be calculated. Snap will derive the same number of factors as there are input (source) variables.

By default, Snap XMP Desktop uses the Jacobi algorithm for calculating factors. Selecting the Varimax option is an extra step which can make it easier to interpret the factors produced.
Understanding the factor analysis table
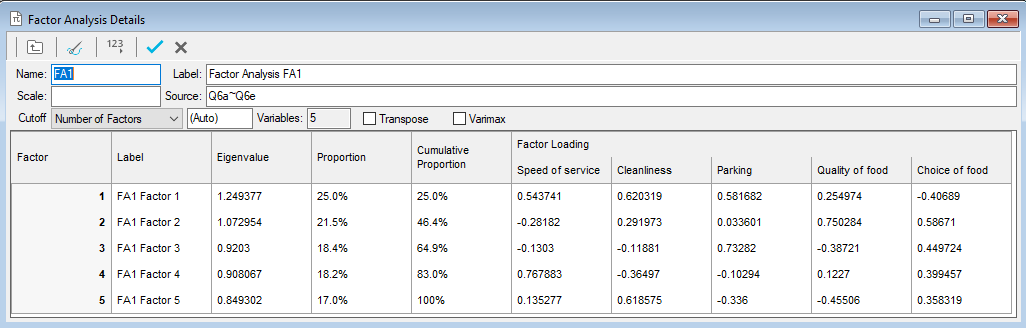
The results table shows for each factor:
Label | An editable text description of the factor. Choose a useful name by inspecting the factor loadings (see below).. |
Eigenvalue | Measure of the weight (or importance) of the factor in representing the variables given as sources. The sum of all eigenvalues is the same as the number of input variables, so any factor with an eigenvalue greater than 1.0 can be thought of as being better than average. Factors are always shown arranged in decreasing order of eigenvalues. |
Proportion | How much of the variability of the data is explained by each factor. It is calculated as the eigenvalue divided by the number of factors/variables and is equivalent to the percentage variability in the data represented by that factor If one factor has a very high proportion, i.e. more than 80%, and the rest are all very low, it is possible that the questions have not covered all aspects of customers’ attitudes. |
Cumulative Proportion | A running total of the previous column (Proportion).Since factors are arranged in order of decreasing eigenvalues, the cumulative proportion represents the percentage variability in the data represented by the specified and all preceding factors. |
Factor Loadings | How much a particular variable contributes to the factor. Large loadings show that the variable is relatively important; smaller values indicate that it has less influence. These loadings will help you provide a suitable name for each factor. |
Arranging factor loadings tables for easy interpretation
Transposing the table
To interpret the factor loadings, it is often easier to transpose the table. Select Transpose to display each factor as a column.
Re-ordering the table
The variable order is set by how the analysis was specified. You can sort the order by importance within each factor. This helps you see which variables have the greatest effect on a factor.
Click in the grey box containing a number at the top of the column or the end of the row containing the factor data. A triangle appears representing the sort order, and the variables re-order by the factor loading for that factor.
Column | Row |
|

| 
| Greatest first |

| 
| Smallest first |

| 
| (blank) Ordered by analysis specification |
Reducing the number of factors
Factor Analysis is a data reduction technique, its purpose is to reduce the initial number of variables to a more manageable number by creating “composite” variables. By default, it produces the same number of factors as there are variables. In a long list of source variables it is likely that several factors will appear to be influenced by the same set of variables. The apparent duplication will usually occur in factors with small eigenvalues. These factors can usually be discarded as being relatively insignificant.
To discard values, you use the Cutoff settings.
Number of factors | Keep the specified number of factors, selecting those with the highest eigenvalues. |
Eigenvalue | Keep the factors with an eigenvalue above the specified value. Some theorists use the rule that factors with an eigenvalues of less than 1.0 should be ignored. |
Proportion | Keep the factors with a proportion above the specified value. Some theorists use the rule that factors with a proportion less than a certain amount, e.g. 10%, should be ignored. |
Cumulative Proportion | Keep the factors which are required to achieve the specified cumulative proportion. Some theorists use the rule that factors should be included up to a specified cumulative proportion, e.g. 80%. |
Weighting in factor analysis
You can apply a weight to factor analysis as you can to other statistics.
For example, if the input variables are rating scale questions with 1 as Very Good and 5 as Very Poor, it is worth specifying a weight to the data so that very good scores have a high value and very poor scores have a low value in the resulting factors.
Applying a weight in the Scale box means:
- the weight will be applied to all multi-choice and grid questions before the factor analysis is performed
- the weight will NOT be applied to quantity questions
If all your source variables are rating scale questions, the weight will be applied to them all, and this will have no effect on the Eigenvalues or Factor Loadings that are produced.
If you have a mixture of variable types, the weight will only be applied to multi-choice and grid questions, and factor analysis results will differ from the same analysis without the Scale applied.
In the box labelled Scale, enter the name of a suitable weight, for example, one which weights codes 1 to 5 from -2 to +2.