Adding charts
Charts show the response data in a visual format, helping individuals understand the responses to the questions. The chart layouts available for dashboards include line charts, bar charts, pie charts, doughnut charts and gauges.
- Line charts show data points connected with straight lines to show how a value changes over a continuous variable, usually time.
- Bar charts compare different categories or variables using the bar length to show the value.
- Stacked bar charts are used to show how the main category is divided into smaller categories. The full bar represents the total for a category, and each segment shows how much a sub‑category contributes to that total.
- Pie charts shows how the total is split into different parts.
- A donut chart is a pie chart with a circular hole in the centre. The ring shows how a total splits into different parts.
- A gauge measures and gives a visual display of the amount, level, or contents of something.
- A radar chart is a visual display showing multiple data points and the variation between them, for three or more quantity variables.
Insert a chart
- Open the Dashboard in the Edit option.
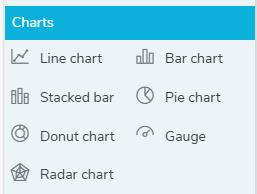
- In the Charts menu, select the chart you want and drag to the dashboard editor. This opens the chart settings with the chart type selected.
- In Title, enter the title description for the chart.
- The Type defaults to the chart type you selected in the menu, but you can change the chart type to any of the available charts or tables.
Chart settings
There are four tabs: Definition, Calculate, Include and Style.
- The Definition tab defines which data creates the chart.
- The Calculate tab gives the option to select the data calculations.
- The Include tab gives the option to include responses with errors, not asked or no reply.
- The Style tab gives the option to display a shadow and customise the padding.
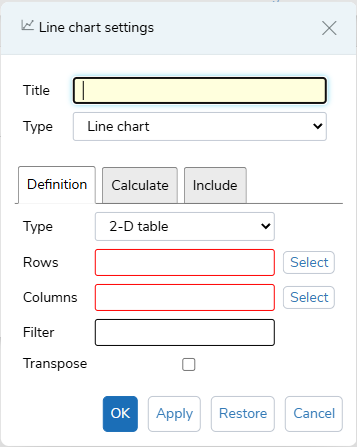
Definition
Each chart definition is set to the default for its chart type, when created. You can change the Type to the options:
- 2-D includes both Rows (Analysis) and Columns (Break)
- 1-D includes Rows (Analysis)
- Grid
- Descriptive statistics
- In Rows (Analysis), click the Select button and choose a variable from the list, then click OK. You can select more than one variable.
- In Columns (Break), click the Select button and choose a variable from the list, then click OK. You can select more than one variable.
- In Filter, enter the filter criteria, e.g. Q1=2
- Select Transpose, if you want to transpose the chart.
Calculate
This tab determines how the data is calculated.
For the 2-D, 1-D and Grid types:
- Choose the Cells option from Counts, Row persents, Column percents or Total percents
- Choose the Base option from Response or Respondents.
For the Descriptive statistics type:
- Select the statistics from Count, Sum, Mean, Min, Max, Range.
- Choose the Base option from Response or Respondents.
Include
- Select Errors if you want to include data with errors
- Select Not Asked if you want to include data that was not asked
- Select No Reply if you want to include data that had no reply
Style
In the Style tab, you can set the shadow and padding.
Save and Apply
- Click OK to save all the changes.
- Click Apply to apply the changes.
- Click Restore to return to the original values.
- Click Cancel to abandon the changes.
Resize the table
You can resize the chart box by dragging the resize arrows.
Examples
Bar chart
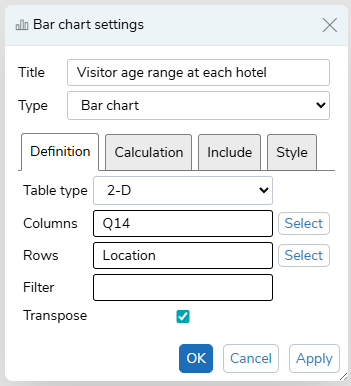
The bar chart shows the visitor age range at each hotel.
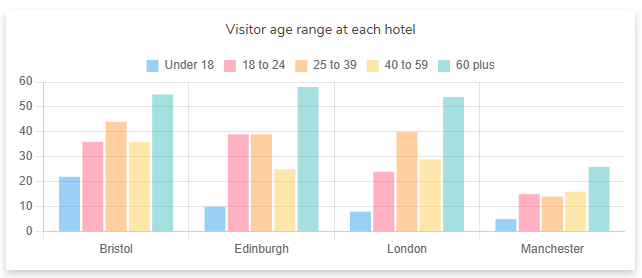
Rows contains the Location and the Columns contains the age range of the visitor. Transpose is on.
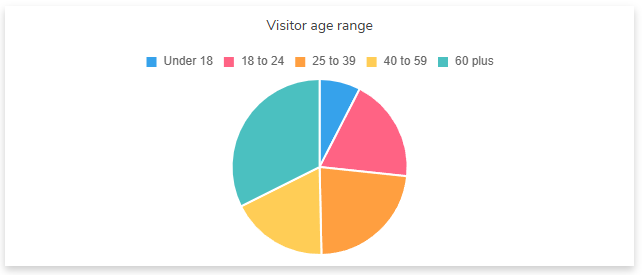
Pie chart
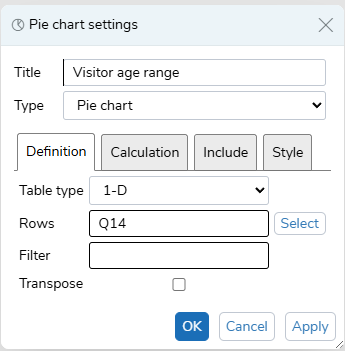
The pie chart shows the visitor age range at all hotel locations.

Rows contains the age range of the visitor.
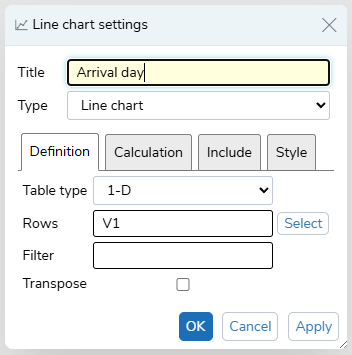
Line chart
The line chart shows the arrival day of hotel visitors over the week.
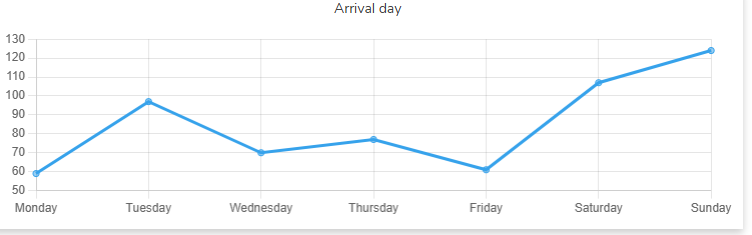
Rows contains the derived variable that calculates the day of the week that the visitors arrive.