Exporting analyses
Moving analyses between surveys
Snap Interchange Format (SnIF) is used to transfer analyses, including tables, charts, word clouds, lists and maps between surveys. For example, if a number of surveys require the same set of analysis definitions, these could be created in one survey, exported in a SnIF format file and then imported into another survey.
In the following example the data is exported via the clipboard. For larger exports, it is recommended that you export to a file.
- Click Analyses
 on the Snap XMP Desktop toolbar. This opens the Analyses window.
 - Select the menu option File | Export to display the Analysis Export dialog.
- Specify the Format as SNAP Xml Format (SnIF Xml).
- Set the Destination as Clipboard.
- By default, this will export all analyses in the survey. If you only need a selection, type the names of the ones required separated by commas, in Content.
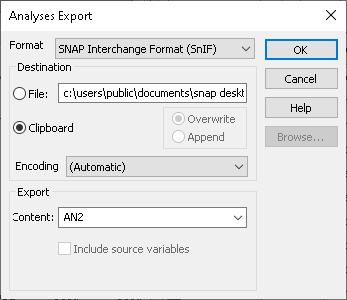
- Click OK to export the selected analyses.
- Open the survey that you want to add the analyses to.
- Click Analyses
 on the Snap XMP Desktop toolbar. This opens the Analyses window.
 - Select the menu option File | Import to display the Analysis Import dialog.
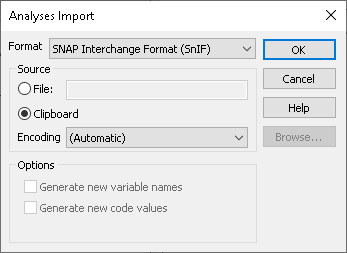
- Set the Source to Clipboard.
- Click OK to import the analysis definitions. They will be added to the survey with all the original details.
- If there are already analyses with the same name in the survey, an error message appears. Click Done then each analysis is displayed so that the name can be changed and the item saved.
Exporting an analysis to use in an external application
Analyses can be exported from Snap XMP Desktop by
- Using the clipboard
- By exporting to a file
You can then import them into a report; either as a picture in a word-processing package, or into a slide show generated in a presentation package. Tables and lists can also be exported in text format into a spreadsheet package, for you to carry out further calculations.
Using the Clipboard to paste an analysis as a picture
- Click Analyses
 on the Snap XMP Desktop toolbar. This opens the Analyses window.
 - Open the analysis in the Analysis Display window.
-
Click Copy
 to place a copy of the analysis on the clipboard.
- Switch to the word-processing or presentation package and choose the menu option Edit | Paste Special. Different packages may use different terminology.
- On the Paste Special options select the picture (Enhanced metafile) option and click OK to insert the picture in the document.
Using the Clipboard to paste a table or list in text format
- Click Analyses
 on the Snap XMP Desktop toolbar. This opens the Analyses window.
 - Open the table or list analysis in the Analysis Display window.
-
Click Copy
 to place a copy of the analysis on the clipboard.
- Switch to a spreadsheet package and choose the menu option Edit | Paste. The table or list is inserted in text format, enabling further analysis to be carried out.
Exporting an analysis as a file
- In the Analysis Display window showing the built analysis, such as a chart, select File | Export to display the Analysis Export dialog.
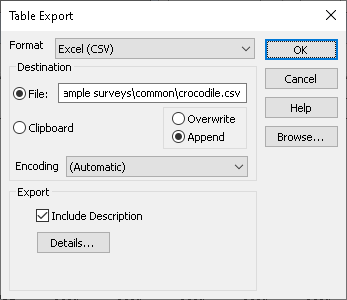
- Specify the Format for the exported analysis. This will depend on the requirements of the package that the analysis is destined for. Comma separated and Tab separated are only suitable for table and list export.
- Comma separated (CSV) each case comprises a series of fields, each separated by a comma. Fields corresponding to literal, date and time variables are surrounded by quote characters.
- Tab separated (TSV) comprises a series of fields each separated by a tab.
- Windows Bitmap (BMP) gives a pixel-based graphic.
- Enhanced Metafile (EMF) gives a vector-based graphic.
- Web format (HTML) gives an HTML export
- Excel (CSV) each case comprises a series of fields, each separated by a comma for use in a spreadsheet.
- The Export option is only available when CSV and TSV formats are selected.
- Leave the Encoding as Automatic unless you know that the software you are importing to requires a different format (If there are problems, try UTF-8 or ANSI format.)
- Specify the Destination by typing in a path and file name or click on Browse.
- Click OK to export the analysis. This can then be inserted or opened in the appropriate package.