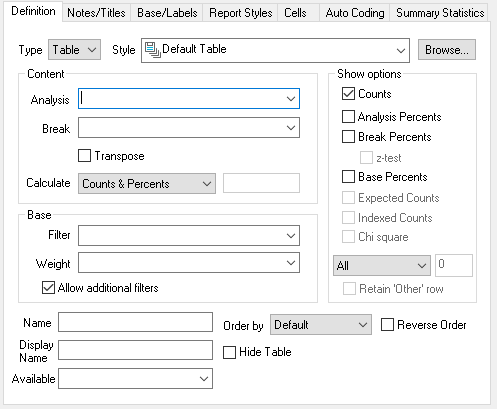
Definition tab
| Area | Description |
| Type | Specifies the analysis as a table, chart, list, cloud or map. |
| Style | Selects the style template appropriate to the defined type. |
| Content | |
Analysis | Specifies one axis for the data to be analysed (normally the rows of a table). This can contain:
|
Break | Specifies the other axis used to split the data into subgroups. This can contain:
Pre-defined tables such as Statistics table, Grid table, Holecount table |
Transpose | Switch the positions of Analysis and Break |
Calculate | Specifies the type of analysis together with a field specifying the analysis data. There are six Calculate values.
The variable entered in the Calculate box adjacent to the Calculate list box is used to calculate the means and sums. |
| Base | If no Base is specified then all respondents in the survey will be included in the analysis. |
| Filter | Defines the subset of data to analyse given as a logical expression. |
Weight | Defines how to alter the calculation to represent a different group of respondents. This can be
|
Allow additional filters | Permits other filters to be applied to this analysis when used in reports. Clear this option if you always want this analysis to appear exactly as defined. |
Show Options | The options available depend on the type of analysis selected in Content and Calculate. |
All | Show all rows or columns in table or equivalent in chart |
Top rows (or columns) | Display following number of rows (or columns) from start of table |
Bottom rows (or columns) | Display following number of rows (or columns) to end of table |
Rows (or columns) above | Display number of rows (or columns) above a specified value |
Rows (or columns) below | Display number of rows (or columns) below a specified value |
Retain ‘Other’ row (or column) | Creates ”Other’ category if rows (or columns) are limited |
Order by | Defines the order in which the analysis data appears
|
| Reverse Order | Select the check box to reverse the selected order |
| Hide Table | Select the check box to hide the analysis display in a report so that only the notes are visible |
| Name | A name by which each analysis can be saved for later recall/reference |
| Display Name | The name that will be used for the analysis when displayed in Snap Online. |
| Available | Enter a condition under which the analysis is visible in Snap Online. Set to No to make the analysis unavailable and leave blank for it to be available. |