Dashboard overview
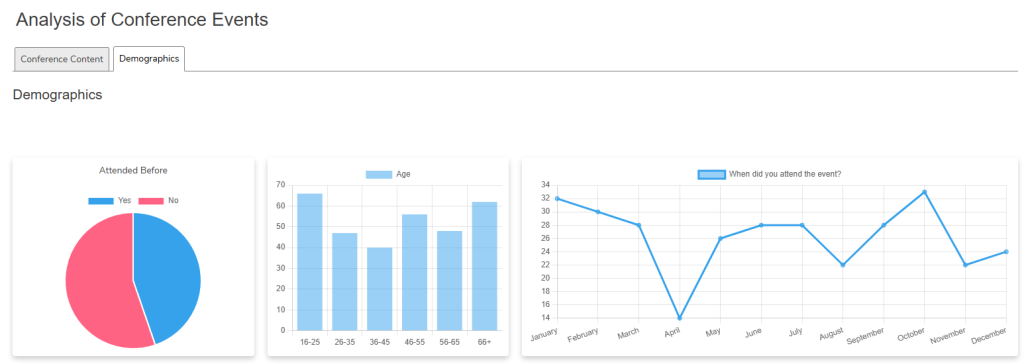
A dashboard is a visual display of important information about your survey. Dashboards use tables, charts, and text to present survey data in an easy-to-understand format.
Dashboards in Snap XMP Online
Dashboards are available for each survey in the Dashboard section, accessed through the survey’s Summary.
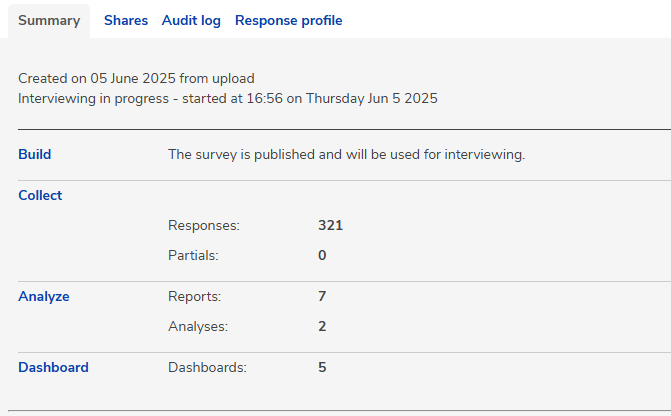
They can also be accessed by clicking the Dashboard link from the Build, Collect or Analyze sections of the survey.

Dashboard features
- Creating dashboards
- Adding content to a dashboard including tables, charts, lists, and text.
- Setting the layout of a dashboard
- Sharing dashboards