Creating a grid table
Many questionnaires contain groups of questions with an identical range of possible answers. These are generally attitude questions and the replies are typically “Very good” to “Very poor”, or “Strongly agree” to “Strongly disagree”. Such groups are called Grids. Each question is set up as a separate variable, but at the analysis stage, they are grouped together.
-
Click
 to display the Analysis Definition dialog box.
- Type into the Analysis field Q6a TO Q6e.
- Select Grid table from the dropdown list in the Break field (or type GRID in upper or lower case). If you leave the Break field blank, Snap assumes that you want a grid table because of the value you put in the Analysis field, but this can be confusing.
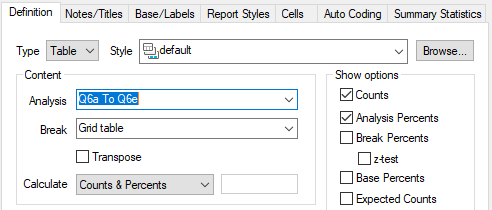
- Click on Analysis Percents so that the percentages of the total of each row are included.
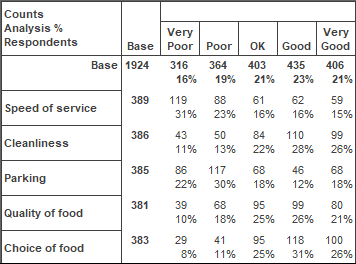
- Click OK to build a grid table.
-
If you wish to alter the specification of the table, click
 .
.
- If you specify the variables in the Break field and GRID in the Analysis field, the axes of the table will be reversed. Alternatively, select the option Transpose.
-
Click
 to save the table. The name will be generated by Snap. If you then wish to work on the table again, it is stored in the Analyses Window
 .
.