Creating a descriptive statistics table
Descriptive Statistics tables are most meaningful when used on questions with a quantity response.
-
Click
 to display the Analysis Definition dialog box.
- Type the required variables names for the statistics in the Analysis field, separated by commas. For example Q11, Q12.
- Select Statistics table from the dropdown list in the Break field (or type STATS in lower or upper case).
- Click OK to build a table of descriptive statistics.
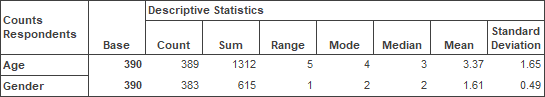
This type of table will not work with Multiple Response, Literal Response, Time or Date variables.
Selecting which statistics are displayed
- Click the Descriptive Statistics tab of the Analysis Definition dialog.
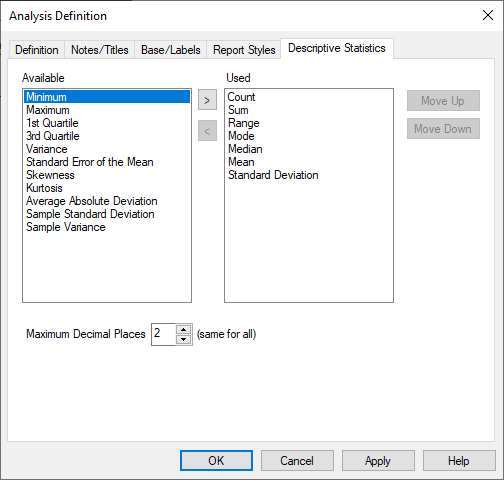
- Select items in the Available pane and use the > button to move them to the Used pane to add them to your table.
- Move them back to the Available pane to remove them from your table.
- You can change the order of the items in your table by selecting them and using the Move Up and Move Down buttons.