Creating a Map for analysis using an existing style
-
Select the
 Analysis Map toolbar button.
- The Analysis Definition dialog will be displayed.
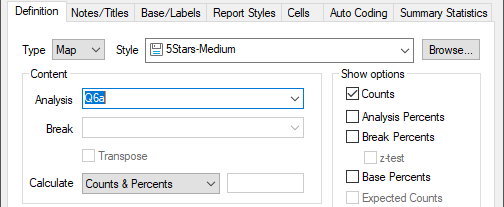
- Specify the variable you wish to display as a Map in the analysis field.
- Select an existing style or click Browse to search for a style that is not in the list.
- Click Apply to display the map in the Analysis Display window.
-
Double-click the new map or click
 to open the Map Control Editor.
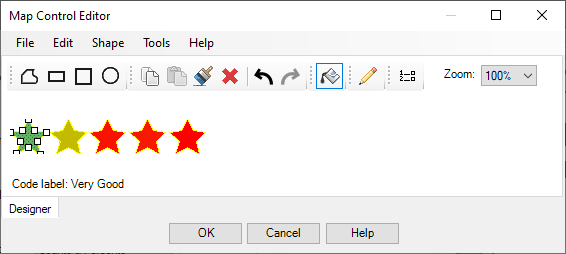
- Click a defined area to select it. You can then make changes to it such as assigning it to a different code.
-
Click
 to specify how the areas are outlined.
-
Click
 to make any changes to the legend or the colors that will fill the specified areas (shaded from maximum to minimum). The Fill definition applies to all areas, as it represents the calculated analysis values.
- When your changes are complete, select File|Save map control to save your Map as a re-usable style file.
- Select File|Exit or click OK to go back to the analysis window.
Changing the code assignments
- Within the Map Control Editor, click an area to select it.
- Right-click and select Assign to code from the context menu, then select the code you wish to associate with this area. You may associate the same code with multiple areas.
Changing the area shapes
Within the Map Control Editor, click an area to select it.
- Drag the area handles (white squares) to change the size and proportions of a shape.
- Right-click and select Shape type to change the shape type.
- If the shape type is a polygon, you can add or delete point by right-clicking a point and selecting Add Point or Delete Point from the context menu.