Changing the style
The Style tab in the settings lets you change the appearance of the widget.
Add a shadow
The shadow style places a shadow around the widget in the dashboard. This is available for all widgets.
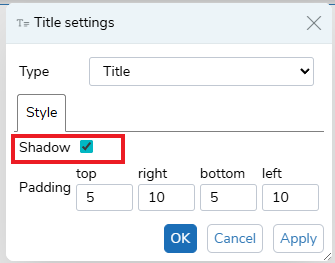
Select the Shadow option to show the shadow. Click Apply or OK to apply the change.
Clear the Shadow option to remove the shadow.
Padding
The padding changes the margins between the edge of the widget display area and the widget, such as, a title, chart or table. The Padding range is from 0 to 20. This is available for all widgets.
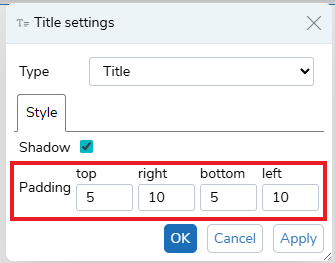
Chart appearance
The charts have additional style options.
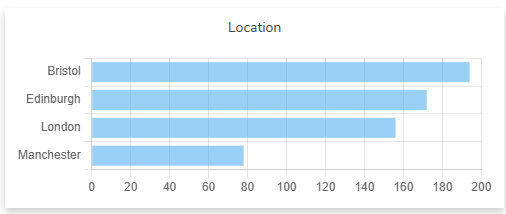
Horizontal axis
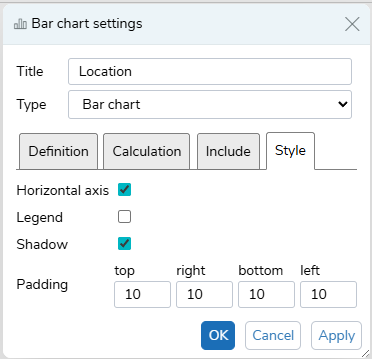
Selecting the Horizontal axis option switches the horizontal and vertical axes. This is available for Line charts, Bar chart and Stacked bar.
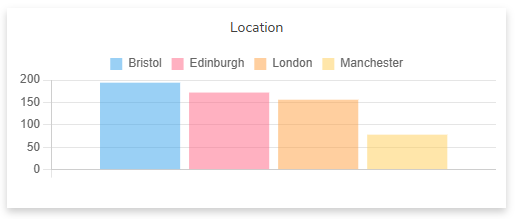
Legend
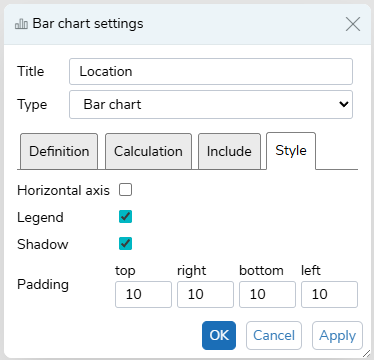
Selecting the Legend option displays the chart’s legend, helping to identify the chart items. This is available for all charts.
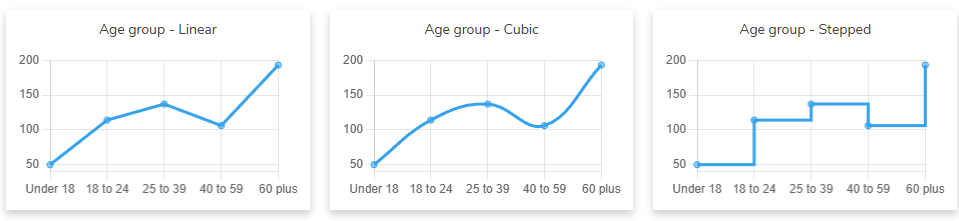
Line interpolation
This changes the style of the line in Line charts only. You can choose from Linear, Cubic and Stepped.
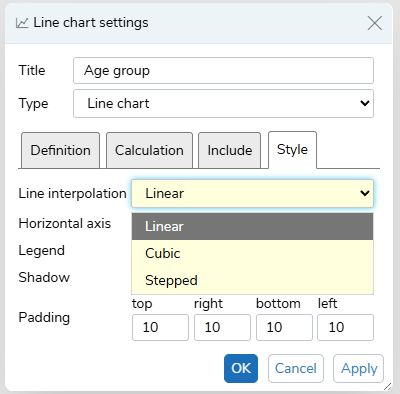
Select the Line interpolation required, then click OK or Apply to apply the changes.
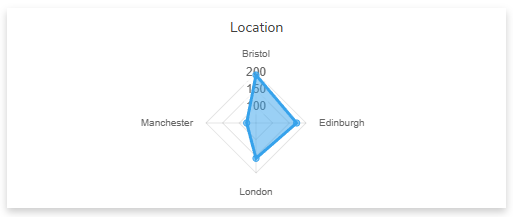
Fill
This is only available in Radar charts.
Select the Fill option, then click OK to apply to apply the changes.
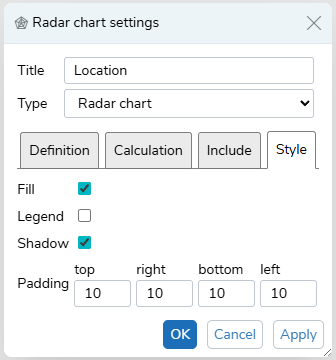
The Fill option fills in the radar chart with colour.