Changing the shading
You can add and remove data points as well as change the colours of each data point in the legend. You must define at least two colours, one set as the minimum and the other as the maximum value. Any additional data points are fixed as mid values.
Open this dialog by clicking Fill ![]() in the analysis Map Control Editor.
in the analysis Map Control Editor.
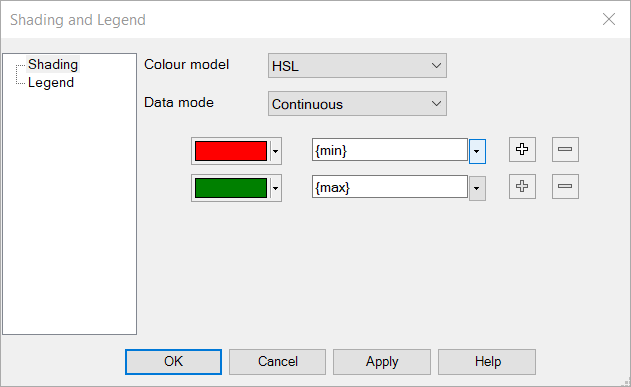
| Colour model | HSL: Hue saturation lightness colour model. Used for creating traffic light maps to go through the colours of red amber green. RGB: Red green blue colour model. Used for creating merged colour maps, where the colours merge smoothly into one another. |
| Data mode | Stepped: only use the defined colours for all values. Continuous: use intermediate colours for intermediate values. |
| + | Add a new data point and item to the legend. |
| – | Remove the data point and item from the legend. |