Changing the legend labels
You can specify the labels shown in the legend. By default, the labels display the value of each data point. You can add your own text instead or a combination of the value and your own text.
Open this dialog by clicking Fill ![]() in the analysis Map Control Editor.
in the analysis Map Control Editor.
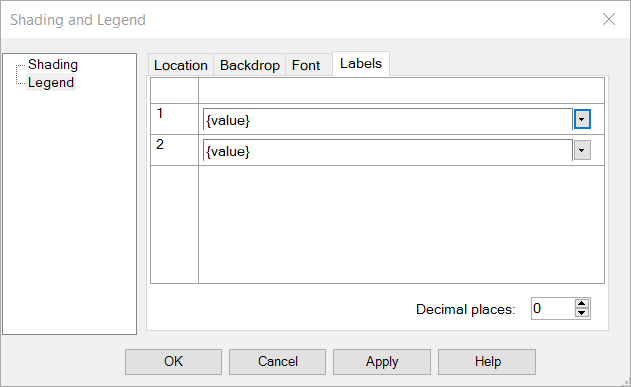
Select the drop down to insert the {value} field at the current cursor position.
Set the number of decimal places for the calculated values displayed in the legend.