Analyzing using the standard reports
Four standard reports are created for each new survey. (Surveys created prior to build 12.10 contain three standard reports)
- The Questionnaire report generates a top-line summary report showing the counts and percentages of responses in the questionnaire layout.
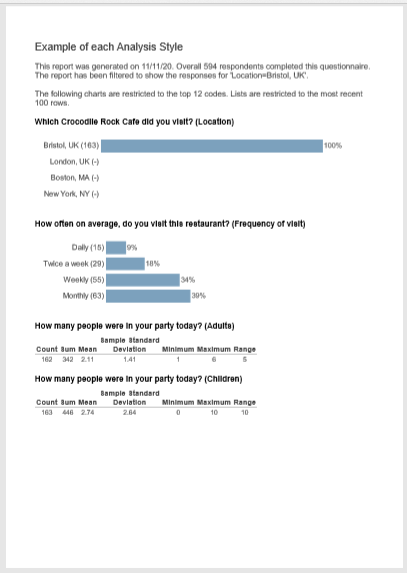
- The Summary report generates a chart, table or list for every question
- The Summary Tables report tabulates responses to all questions.
- The Summary Dashboard report is used to generate an HTML summary report with images of each chart, table or list for each question and displayed in a double column format. (This report is available for surveys created using build 12.10 and after.)
You can find these in the Reports window.
Preview and print the standard report
- Click Reports
 on the toolbar to open the Reports window.
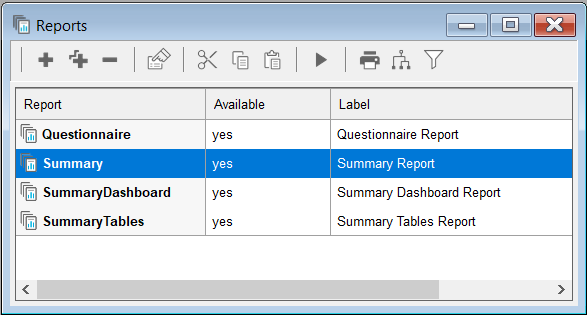
- Select the report required in the Reports window.
- Click the Execute
 button on the Reports window toolbar to run the report. This opens the Report Execution dialog showing the report selected in the window title.
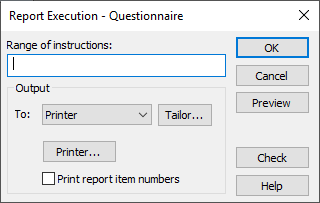
- Click Preview to preview your report on screen.
- Close the preview window.
- Click the Execute
 button on the Reports window toolbar again to open the Report Execution dialog.
 - In To, select the output type: Printer to print the report or Export to export to a file. If Print is selected the Printer button allows you to select a different printer. If Export is selected you can select the file type.
- Tailor allows you to set the page details for a printed report or file details for a printed report
- Click OK to run your report to your printer.
An example of the Summary Report for the sample survey Crocodile Rock Cafe.