Analysing several variables in a single table
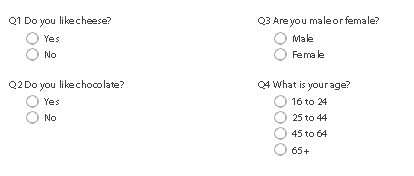
This tutorial explains how to set up cross-tabs such as pivot tables and contingency tables. It assumes that you have a questionnaire with four questions, shown below, and shows you how to create a single table combining the data from the four questions.
You can create cross-tabs and charts from category variables where one variable’s codes provide the columns and another variable’s codes provide the rows. It is possible to combine category variables in your analysis.
There are three ways of combining category variables in a cross-tab.
- Combining variables (WITH) where all the codes are treated as if they belonged to a single variable, with one column per code
- Combining all possible codes (PER) where every combination of codes available between the variables is given a column
- Combining variables with identical codes logically so you can see if either or both codes have been selected. (This is not dealt with in this worksheet)
- The codes can be logically ANDed together so you get a count if both codes have been selected
- The codes can be logically ORed together so you get a count if either code has been selected
Step 1: Creating a cross-tab showing missing responses
This shows you how to create four simple cross-tabs showing people who like cheese and chocolate by age and gender and then shows how to combine them into a single table. It also discusses missing answers. If you add percent scores to your cross-tabs, you need to be clear if you are displaying a percentage of all those who took the survey or all those who answered the question. You can include or exclude respondents who have not answered a question.
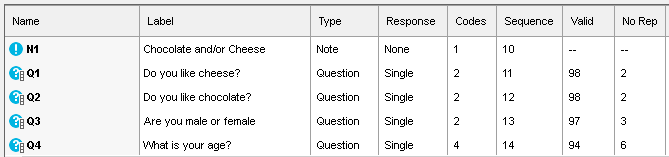
The survey example had 100 respondents. None of the questions has been answered by all of them.
-
Click
 to open the Analysis Tables dialog.
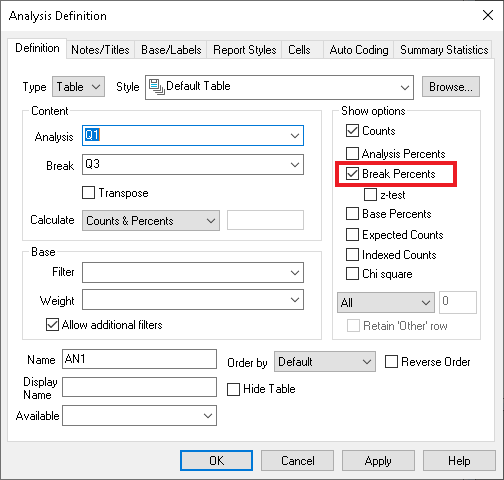
- Enter Q1 in the Analysis field and Q3 in the Break field to give a table of people who like cheese broken by gender.
- Check Break Percents, which shows each answer as a percentage of the column totals for the break variable (Q3).
-
Click OK to create the table then click
 on the table toolbar to save the table.
- Create three more tables, Q2 broken by Q3; Q1 broken by Q4; Q2 broken by Q4.
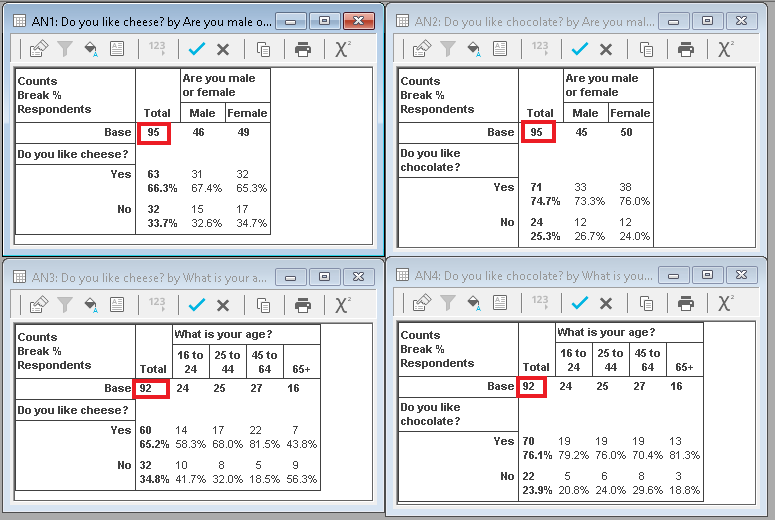
Note that the Base used in the tables is different. This is because the analysis base consists of people who have answered both questions. This is because the analysis excludes no reply responses.
-
Click
 on the table toolbar for AN3 to open the Analysis Definition dialog for that table (liking cheese by age).
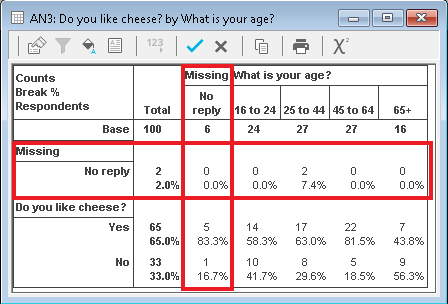
- Click on the Base/Labels tab. Change the No Reply value of Exclude to Show for the Analysis and Break values and click Apply.
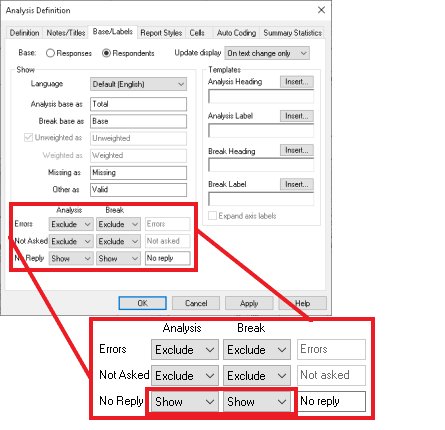
A new row and a new column are added to your analysis, showing the no replies, and the percentages are re-calculated as percentages of the new base. (You can change Exclude to Hide to re-calculate the percentages without including the row/column for the missing responses.)
Step 2: Showing several variables in the same cross-tab
- Create a new table. Put Q1 WITH Q2 into the Analysis field. This puts the response counts to the cheese and chocolate questions in the table.
- Put Q3 PER Q4 in the Break field. This puts every possible combination of the age and gender questions in the table as a separate column.
- Check Base Percents. This uses the same base to calculate the percentages across the table.
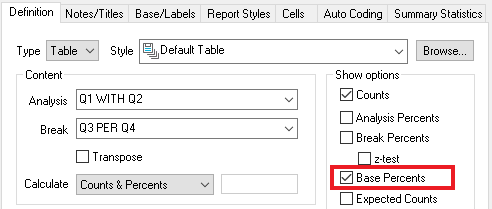
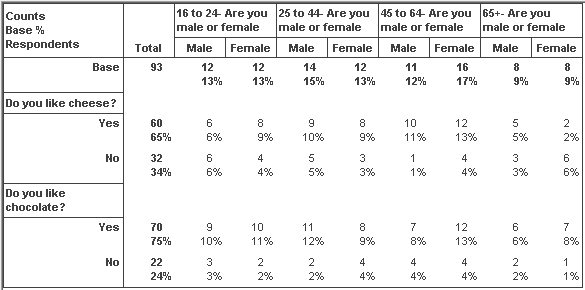
- Press OK to build the cross-tab. The rows show the responses to both the cheese and the chocolate question. The percentages of the base are calculated separately for each row. The columns show each possible combination of the age and gender questions. The percentages are calculated across all the columns.
-
Click
 to save the table.
If there is a topic you would like a tutorial on, email to snapideas@snapsurveys.com