Statistical calculations on tables
You can perform a chi-squared test to see if there is a significant relationship between two variables.
You can display indexed counts or sums to give a relative measure of individual cell values.
Applying the chi-square test
The Chi-square test can be applied to single-response variables. It compares observed (actual) and expected (theoretical) values in order to establish whether there is a significant relationship between two variables in a table.
To calculate the Chi-square Statistic and related statistics for a cross-tabulation or grid table,
- select the Chi square option in the Analysis Definition dialog
-
click
 on the table analysis toolbar
The Chi-square and associated statistics will be displayed above the table
You can display the expected values by selecting the Expected Counts option in the Analysis Definition dialog .These are the values that would be expected in each cell of the table if the row variable were not influenced by the column variable or vice-versa (the Null Hypothesis). They are calculated as:
(Row Total) x (Column Total) / Table Total (Base).
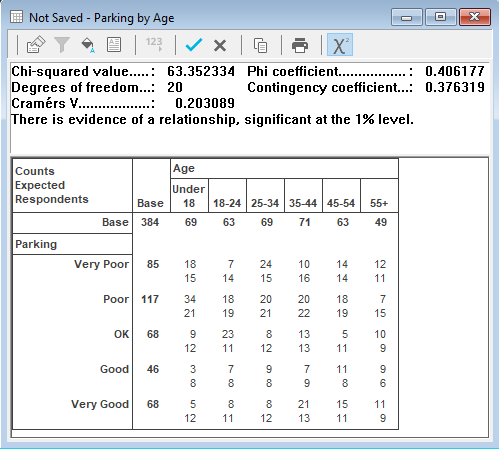
Since you cannot always compare Chi-squared values directly, Snap generates a statement about the result.
The interpretation of the Chi-square test result follows a seven point scale and categorises the certainty of a relationship (or non-relationship) between the variables in the cross-tabulation as follows:
Message | Meaning |
There is evidence of a relationship, significant at the 1% level | There is a very strong relationship between the variables. |
There is evidence of a relationship, significant at the 5% level | There is a strong relationship between the variables. |
There is evidence of a relationship, significant at the 10% level | There is a relationship between the variables. |
The test is inconclusive | The variables are neither related nor unrelated. |
There is evidence of no relationship, significant at the 10% level | There is evidence of no relationship. |
There is evidence of no relationship, significant at the 5% level | There is strong evidence of no relationship. |
There is evidence of no relationship, significant at the 1% level | There is very strong evidence of no relationship. |
Error: Chi-squared test invalid. Degrees of freedom is zero | There is not enough data to calculate the Chi-square statistic |
The information given in the Chi-square report is as follows:
Detail | Meaning |
Chi-square value | 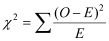
where O is the observed (actual) value, and E the expected value for each cell. |
Degrees of freedom | Relates to the number of choices that can be made in fixing the values of the expected frequencies. It is calculated as 
where r is the number of rows in the table and c is the number of columns. The above is a 5 by 5 table, and therefore has 16 (= 4 4) degrees of freedom. |
Cramérs V | Used to compare tables of different dimensions and different sample sizes. It is calculated as 
where n is the number of cases and k the smaller of the number of rows and columns. Its value always lies between 0 and 1. |
Phi Coefficient | Calculated as 
where n is the number of cases. For 2 by 2 tables Phi always lies between 0 and 1. If one dimension is greater than 2, Phi can be greater than 1. Phi can be used to compare tables of the same dimension but different sample sizes. |
Contingency Coefficient | Calculated as 
It will always have a value between 0 and 1. Tables of different dimensions cannot be compared. |
Evidence of Relationship | A statement indicating the strength of the relationship (or non-relationship) between the row and column variables. This is used because comparison of chi-square values from tables of different dimensions or different sample sizes is meaningless. |
Warning | This appears when a large number of cells in the table have small Expected Values. The reliability of the Chi-square test reduces as the proportion of cells with small expected values increases. A warning appears if more than 20% of the cells of a table have an expected value of less than 5. |
Indexed Values
Indexed Values are widely used in product research and other projects to give a relative measure of individual cell values. Indexed Values can be shown on the table by checking the appropriate box (Indexed Counts or Indexed Sums) option in Definition tab of the Analysis Definition dialog.
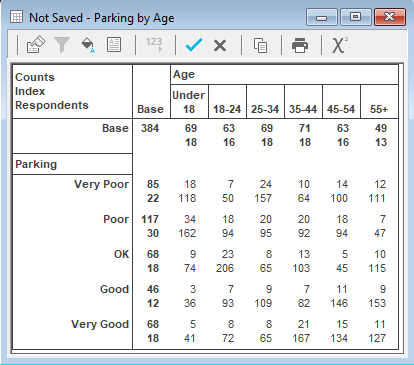
In general, for any individual cell in the table, the corresponding index value can be calculated from the formula:

where: | v is the original cell value |
| c is the column total for the column in which the cell occurs |
| r is the row total of the row in which the cell occurs |
| t is the table total |
The figure of 100 represents a norm or expected value. Thus index values less than 100 would be considered lower than expected and index values of greater than 100 would be considered higher than expected.