Viewing the analyses
Analyses, such as tables and charts, that are created in Snap XMP Desktop can be viewed in the Analyze section in Snap XMP Online.
- In Snap XMP Online, open the survey and go to the Analyze section.
- Click on the Tables & charts menu on the left to show the list of available analyses. These can be tables, charts, lists, word clouds and maps.
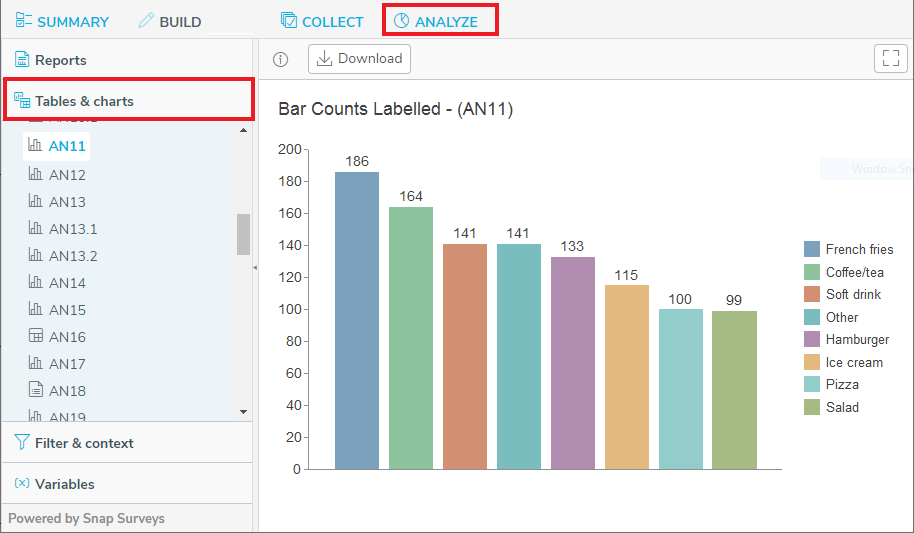
- Click on an analysis name to generate the analysis from the data responses. You can run analyses on the responses while interviewing is taking place as well as after interviewing has closed.
Downloading the analysis to a PDF file
You can download an analysis to a PDF file that can be imported into other applications to further analyze the survey responses.
- In the Analyze tab, click the Tables & charts menu on the left to show the list of available analyses.
- Click on an analysis name to generate the analysis from the data responses.
- Click on the Download button to generate a PDF file.
- The download is found in the Downloads folder or another location as determined by your device or your web browser settings.