Introduction to the analysis variables window
The Analysis Variables window displays a summary of all the analysis variables including auto category variables, factor analyses, cluster analyses and groups that have been created in the survey. Analysis variables are derived from other variables, according to criteria you specify.
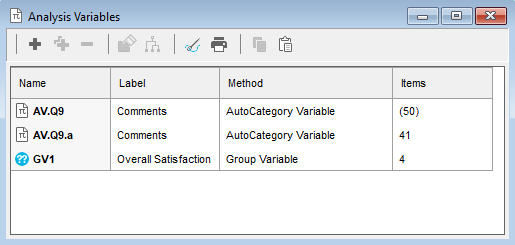
- Auto category variables
- These categorise open response variables into codes. You can then analyse the resulting codes and display them as clouds, frequency tables etc.
- Group variables
- Group variables allow you to treat a group of similar variables as a single variable: for example grid questions. The variables must share a code list.
- Factor analyses
- Factor analyses summarises the responses to several variables as a composite variable. It allows you to look at underlying patterns in data.
- Cluster analyses
- Cluster analyses analyse factor analyses, and create variables based on how the responses are clustered together.
Button | Menu Option | Description |

| Edit | New | Create new auto category variable, group variable, factor analysis or cluster analysis |

| Edit | Clone | Clone variable or analysis and show details. |

| Edit | Delete | Confirm then delete selected item |

| Edit | Modify | Show details of selected item. |

| View | Sources and Dependents | Show the Sources/Dependencies dialog. |

| Tailor | Variables | Set the default options for the variables. |

| File | Print Report | Print the analysis variables report |

| Edit | Copy | Copy selection information on the Clipboard. |

| Edit | Paste | Create a group or analysis from information on the Clipboard. |