Introduction to cluster analysis
Cluster analysis is used as a method of segmenting the market on a combination of variables rather than the usual straightforward segmentation variables such as age, gender, location, etc. It is most effective when used with quantity variables or failing that, single-response variables with relatively many possible codes.
All of the source data should be at least ordinal by nature, and ideally of interval or ratio type. That is, if a single response variable is used, it should be one where the codes show an ordered increase or decrease in response. Thus, an ordered age variable would be acceptable but a gender or geographical region variable would not.
Cluster analysis is an exploratory technique designed to identify patterns in data that may not be immediately obvious. Its object is to sort cases into groups, known as clusters, so that the members of a particular cluster are similar to each other but members of different clusters are dissimilar.
It is not a classification technique as it makes no assumptions about the nature of the groups or clusters prior to the analysis being carried out. The groups are constructed based on the data cases provided with each case being assigned to the cluster that it is most like, and each cluster being defined by the characteristics of its members.
The algorithm for the Cluster Analysis used in Snap XMP Desktop, known as k-means clustering, is as follows.
- The user specifies how many distinct clusters are required and which variables are to be used in the analysis.
- Each cluster is then assigned a value for each variable. Typically, this will be done arbitrarily taking into account the range of values for each variable. As an example, if only two variables are specified, they could be plotted on a two-dimensional scatter graph with the cluster centres represented by points on the graph.
- Having assigned the initial cluster centres, Snap then considers each case in turn and calculates which cluster centre it is closest to. The case is then assigned to that particular cluster.
- Once all cases have been considered, and allocated membership of one of the clusters, the cluster centres are recalculated as the mean value of all the members of that cluster.
- A consequence of recalculating the cluster centres is that some of the cases may now be in the wrong cluster. That is, the centre of the cluster of which it is a member may have moved further away from them, while the centre of a nearby cluster may have moved closer.
- Snap repeats the previous step, assigning each case to the cluster whose centre is closest, until convergence is reached.
Initially there is likely to be considerable movement between clusters, however convergence is quickly achieved in most cases. Typically, successive iterations will generally see fewer cases move from one cluster to another, meaning that the cluster centres do not change so much and hence there will be less movement in the next iteration.
Standardised values
Snap uses Standardised Data Values to perform the Cluster Analysis and allows the user to see the standardised values in the results if desired. The Standardised Data Values are calculated by applying a transformation to the initial data set, creating a set of values with a mean of 0 and a standard deviation of 1.
This is an essential process as the source variables may have very different orders of magnitude. For example, consider two quantity variables, Age and Salary, included in the source data. It is probable that the values for Salary will of a different order of magnitude (tens of thousands) from that of Age (tens). If the Cluster Analysis used the actual data values, differences in salary would be given considerably more importance that differences in age. The resulting clusters would be determined predominantly by differences in salary. Standardising the data sets creates a “level playing field” so that all source variables are compared on equal terms.
When the results are reported, it is often unhelpful to use the standardised values as these have no units and are therefore have limited use for interpretation. Snap XMP Desktop by default reports the actual data values.
Snap measures the distance between cases and cluster centres using the Euclidean method. That is, the straight line distance between the two points on a graph.
Standardised Data Values are calculated by subtracting the mean value of the entire data set and dividing the result by the standard deviation.
Running means
The specification for Cluster Analysis includes an option to use Running Means. By default, this is not selected. If the Running Means option is switched on, then the calculation of the cluster centres takes place every time a data case is allocated to a new cluster, rather than waiting until all cases have been evaluated.
Creating a cluster analysis
- Open the survey.
-
Click the
 button on the toolbar to open the Analysis variables overview window. The overview window shows all the Group and Auto-category variables and Factor and Cluster analyses currently set up in the current survey.
-
Click the
 button and select New Cluster Analysis… from the menu. The Cluster Analysis Details window appears.
- Specify a name and descriptive label as required.
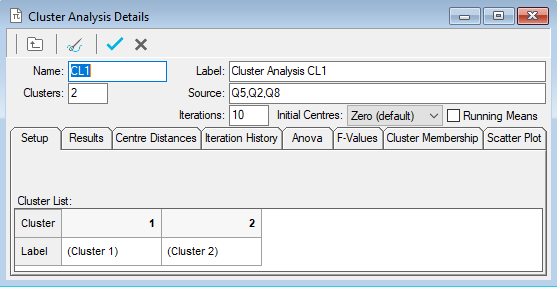
- Specify the list of variables from which clusters are to be extrapolated in the Source field. For example, specify Q5, Q2 to have clusters evaluated for those two variables. Use range definitions if the variables fall into a consecutive range, for example Q6a to Q6e would include all variables between and including Q6a and Q6e.
Once the source variables have been specified, the clusters will be determined and results may be reviewed or further qualified by clicking on the appropriate tab.
Initial centres
If clusters are not clearly defined, the initial centres selected may have an effect on the clusters produced. As an extreme example, if you have data that naturally looks like two clusters and you ask for three clusters, the third cluster does not naturally have a suitable centre, so its final position will be affected by its starting position.
Look at the centres and the scatter plot to see if you think the clusters are well spaced for the data – the F-values help with this too.
The Initial centre options are:
Zero (default) – start at zero, so the clusters move away from zero sequentially.
First cases – the n cluster centres are set to the first n cases. This provides some real positions as initial centres. It is rather open to influence from what people have answered.
Evenly spread – for each source variable, find the minimum and maximum values. The first cluster centre starts at the minimum values and the last cluster starts at the maximum values. The other clusters are evenly spaced in a ‘line’ between these extremes. This will favour results ranging from generally good to generally poor
Examining a cluster analysis
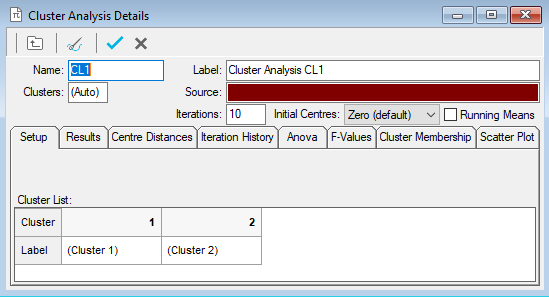
The Cluster Analysis dialog allows you to examine the defined clusters in different views by selecting different tabs.
- Create a new Cluster Analysis based on the Crocodile Rock Cafe survey with
- Name: CL1
- Label: Cluster Analysis CL1
- Clusters: 2
- Source: Q5, Q2, Q8
- Click on the Results tab to show details of the cluster centres for each variable and the count of respondents in each cluster.
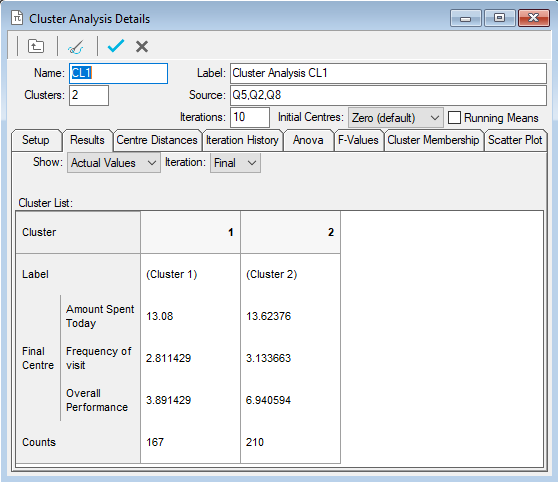
- By default, actual values will be shown (as indicated by the Show setting Actual Values. Under this setting, values for quantity variables will reflect the actual answers; values for categorical (single response) variables will reflect the code values.
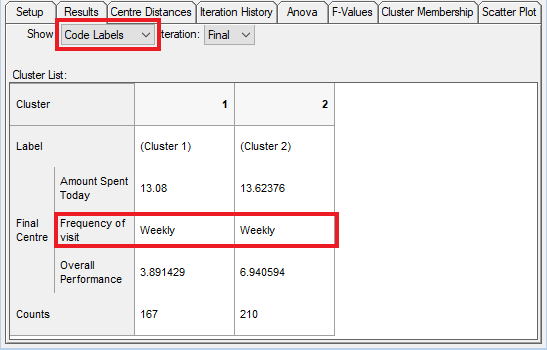
- Change the Show setting to Code Labels to show code labels for categorical variables. Results for quantity variables will still reflect the actual values of those variables.
- Change the Show setting to Standardised to show standardised results for all variables.

- Use whichever of the Show settings is appropriate for determining a description for each of the clusters. A descriptive label can be allocated to each cluster in either the Results tab or the Setup (previous) tab.
- Click the Centre Distances tab to see the table of cluster centre distances. The distances are shown between clusters either as Actual Values (with the Show setting as either Actual values or Code Labels) or Standardised Values.
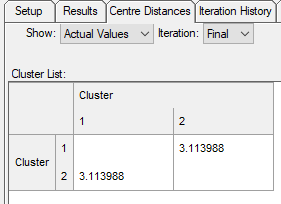
- To see how cluster centres move during the iterative calculation process, click on the Iteration drop-down. The default setting, Final, shows the result at the end of the last iteration.
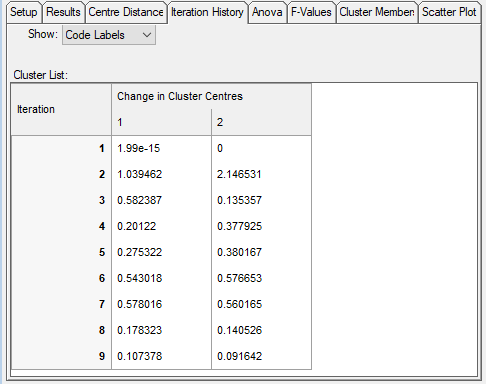
- For an alternative view of the movement of cluster centres, click the Iteration History tab to show the change in each centre during the iterative calculation process.
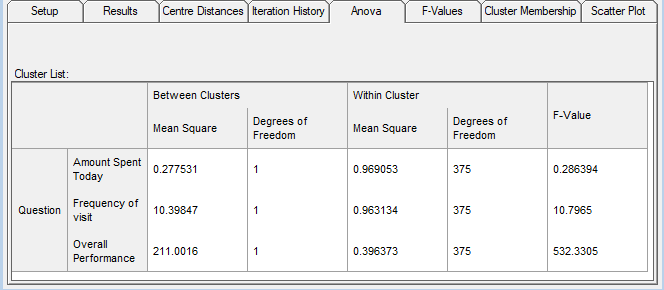
- Click on the Anova tab to show the results of the Analysis of Variance for the current cluster solution. The Mean Square values show the average (mean) squared distance between each of the cluster centres (Between Clusters) and between each case and the centre of the cluster to which it belongs (Within Clusters). The F-value is a statistical measure of how distinct the cluster groups are; a high F-value will indicate highly distinct sub-groups.
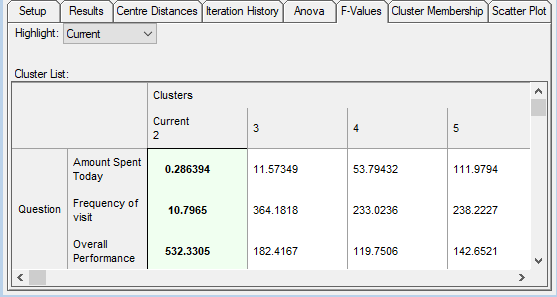
- The F-Values tab shows a summary of the F-values for several different cluster solutions, with the current solution highlighted. Generally speaking, high F-values indicate that the members of each cluster group are homogeneous, and that the cluster groups are highly distinct from one another.
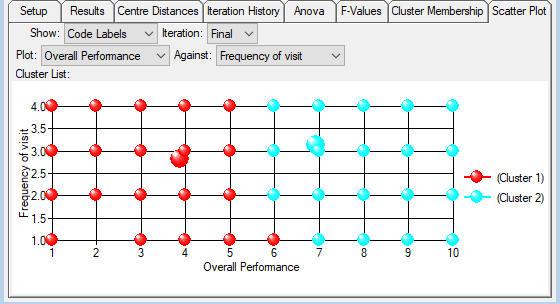
- The Scatter Plot tab shows a plot of data case locations and cluster centres. Each cluster centre is automatically allocated a unique colour. The points representing each case are coloured to indicate the corresponding cluster they have been allocated to. The plot is of one variable against another. If there are more than two variables in the source, drop-down boxes enable you to specify which two should be plotted.
Although F-Values can be used as an indicator of how many cluster groups should be specified, it is not advisable to rely exclusively on this measure. The solution with the highest F-Value will not necessarily be the ideal solution, and users should rely on their own knowledge of the customer base.