Including the number of filtered cases in a report instruction
Often a report is run using a filter to view a subset of the overall response data. Including the filter information and number of filtered cases gives the recipient of the report a clear description of the data they are viewing.
In Snap XMP, you can include the filter and the number of filtered cases in a report instruction using a Survey field. When the filter is changed, the filter survey fields in the instruction will show the updates when the report is run.
In this tutorial, the Summary report is used. The Summary report is supplied with Snap XMP Desktop and each questionnaire contains this report. This report can be customised as required in the questionnaire.
Step 1: Inserting the survey field in your report
-
Click Reports
 on the Snap toolbar to open the Reports window.
-
Select the Summary report and click
 to make a copy of it. This will ensure that you can go back to the original if you make any mistakes.
- Close the copy and open the Summary report.
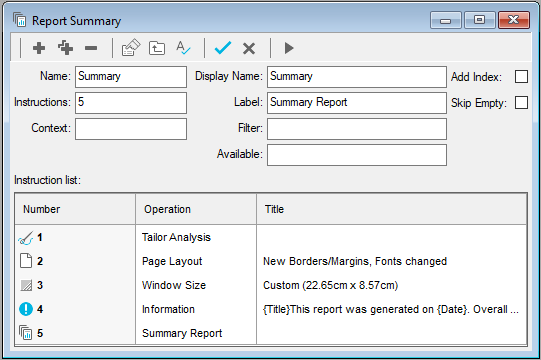
- Double-click the Information instruction to open it. The text may vary depending on the version of Snap or survey template used to create the questionnaire. The instruction shown is from a questionnaire created in Snap XMP Desktop using the Blank Template. This instruction already includes a sentence showing the number of filtered cases. The following instructions show how to add this sentence.
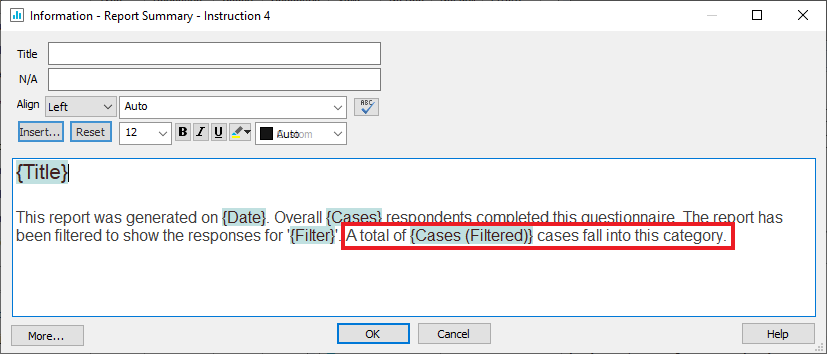
- Click in the text area where the text will start and type ‘A total of ‘
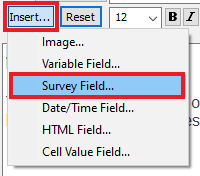
- Click the Insert button and select Survey Field from the options.
- In the New Survey Field dialog, select Cases(Filtered) as the Field. In Modify case, select Normal as the case.
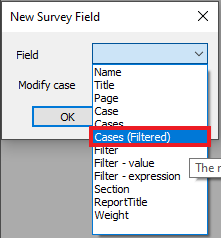
- Click OK to insert the field.
- Enter the remaining text ‘ cases fall into this category.’
- Click OK to save your changes to the instruction.
-
Click Save
 to save the changes to the report.
Step 2: Applying the filter
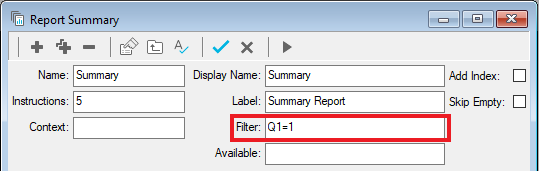
- Add the filter to the Filter field at the top of the report window. For example, using the question Q1. Are you a member of Activate Swimming Club?
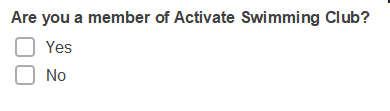
- To create a report on all the members of the club, enter Q1=1 in the Filter field.
-
Click the Execute
 button on the report toolbar to run the report.
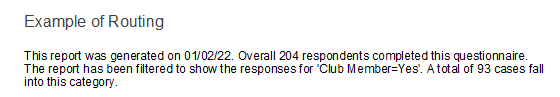
The data that you have referenced will be filtered, so that when you run the report, you will see the number of filtered cases.
- When you are happy with the new version of the report, delete the cloned back-up report.
If there is a topic you would like a tutorial on, email to snapideas@snapsurveys.com