Filtering the data responses
After data has been entered, you can browse through the cases for review or to make changes where necessary.
You can search for a specific subset of data cases by defining a filter. A filter is specified as a logical formula in the same way as a filter in tables and charts, but it is possible to include raw data in the specification. The following examples provide an indication of some of the uses:
Creating a data entry filter
-
Click
 to display the Data Entry window for the current survey.
-
Click
 to open the Data Entry Filter dialog.
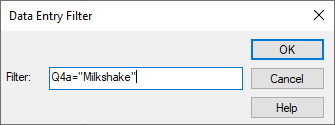
- Add a filter to identify the specified cases. The contents of the filter should be a logical expression. For example, Q4a = “Milkshake” filters all cases where the characters “Milkshake” appear in the text for Q4a.
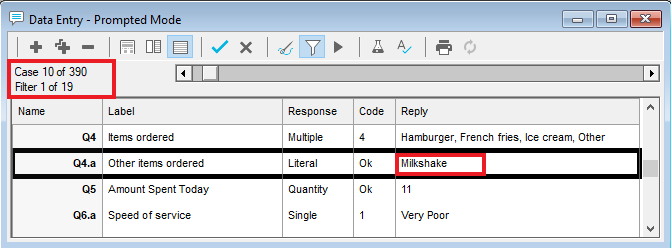
- Click OK and the first case that meets the filter criteria is displayed. It will display how many cases match the filter, for example “Filter 1 of 19” means this is the first case out of the 19 in total that match the filter criteria. It also gives the case number of the displayed case.
- Use the arrow keys or scroll bars to move through the cases depending on which data entry method is being used. If no cases are found which meet the filter specified or there is an error in the filter expression, a warning message will appear.
- Press
 again to remove the filter.
Examples of filters
- The filter Q2=1 will select all cases where the respondent has given answer 1 to question 2.
- The filter Q1 ER will select all cases where the results of processing the data have fallen outside all other codes, and have been set to Error. A similar filter can be used for No Reply (Q1 NR) and Not Asked (Q1 NA). The filter Q1 MISSING will select all cases where the results of processing the data have fallen into any one of the categories of Not Asked, No Reply or Error.
- The filter Q1 OK will select all cases where a valid response has been given for Q1.
- The filter CASE=20 will find case number 20. CASE>50 will select all cases beyond case number 50.
- The filter Q2=1 AND CASE>50 will select all cases where the respondent has given answer 1 to question 2 where the case number is higher than 50.
Using patterns in filters
You can use patterns in filters to enable you to provide a non case sensitive search for a string. For example, to search for “Milkshake” or “milkshake” (or any other combination of cases), you could apply the lower case system filter. The lower case system pattern converts text to lowercase. By using it in the filter, you convert all versions of the text to lower case before applying the filter.
For example; q4a as lower case= milkshake.
You can use the result of any transformative pattern in a filter. The data is transformed by the pattern before it is filtered. This is useful for searching for data that may have been entered in a non-standard format.
Example of setting up a variable for a complex filter
The following example assumes that it is regularly required to analyse survey data for the following groups: Males under 45, Males 45 plus, Females under 45, Females 45 plus. A variable can be set up to identify each group as a code thus making specification of the relevant filters quicker and easier.
- Click
 to display the Variables window.
 - Click
 to add a new variable.
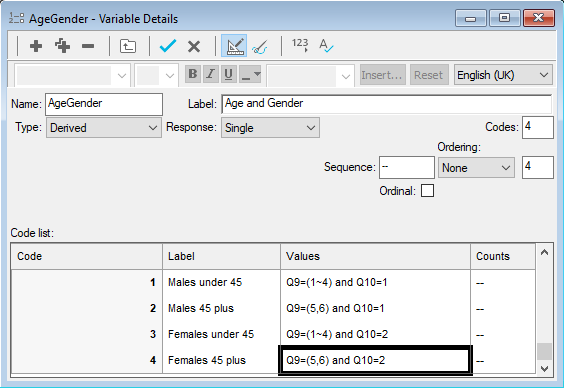
 - Specify the Variable Details. Each participant will only fall into one of the new codes.
- Name: AgeGender
- Label: Age and Gender
- Type: Derived (the variable will derive its data from other existing variables.)
- Response: Single
- Specify the Code Details:
Code | Code Label | Value |
1 | Males under 45 | Q9=(1~4) AND Q10=1 |
2 | Males 45 plus | Q9=(5,6) AND Q10=1 |
3 | Females under 45 | Q9=(1~4) AND Q10=2 |
4 | Females 45 plus | Q9=(5,6) AND Q10=2 |
-
Click
 to save the variable.
You can now use the variable to filter data by age/gender groups when browsing or editing data. For example males aged 45 plus can be identified using the filter AgeGender=2.
Finding errors
If a case is showing a variable as Error, then there are a number of possible reasons for this.
- imported data does not match the variable set-up, for example, the variable has 5 codes but that case has a number 6 entered
- the variable itself has been altered after data was entered, for example a Multiple Response variable was changed to a Single Response variable, therefore any multiple answers would be displayed as errors
- new variables that rely on information from existing variables have been added since the data was entered but no data has been entered into the new questions
To find out what is causing the error:
-
Click
 to display the Data Window for the current survey.
-
Click
 to open the Data Entry filter dialog.
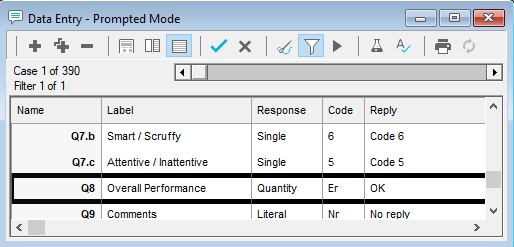
- In the Data Entry filter dialog, type in the name of the variable followed by ER.
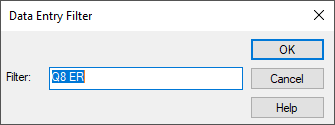
- The data responses that match the filter expression are displayed. You can then work out why the answer is in error, and whether it is the variable or the response that needs to be edited
In this example the words ‘OK’ have been entered as the response to a quantity variable.