Creating running totals
You often have a set of questions where you wish to total the answers. For example:
- asking how many hours a week respondents spend doing different things
- asking how much money respondents spent on different activities during a visit
- asking respondents to share a fixed amount or percentage between a set of options
The amount allocated to each option gives the relative importance of each. This gives good numeric data for analysis, but is quite difficult for respondents.
This worksheet shows you how to calculate a running total as the respondent completes the answers. It explains how to create a set of Open Series First and Open Series Next questions for quantity responses and put a running total into the final response. It also shows you how to set a valid range on the total, so that respondents cannot move to the next page if the total has overrun.
Please note: The Open Series First and Open Series Next question styles are new in Snap XMP Desktop. If you are using a survey that has been upgraded from Snap 11 Professional then the equivalent question style is Open Grid First and Open Grid Next.
Step 1: Create your set of questions
The first step is to create the group of questions that need to be totalled. These must be quantity questions.
- In Snap XMP Desktop, open the survey in the Questionnaire window.
-
Click New Question
 to create a new question.
- Select Open Series First as the question style
- Select Response in the next dropdown then select Quantity as the response type.
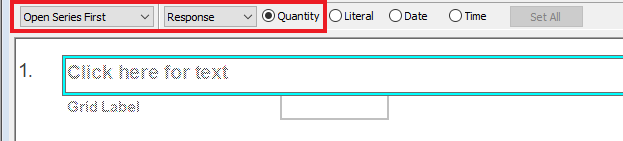
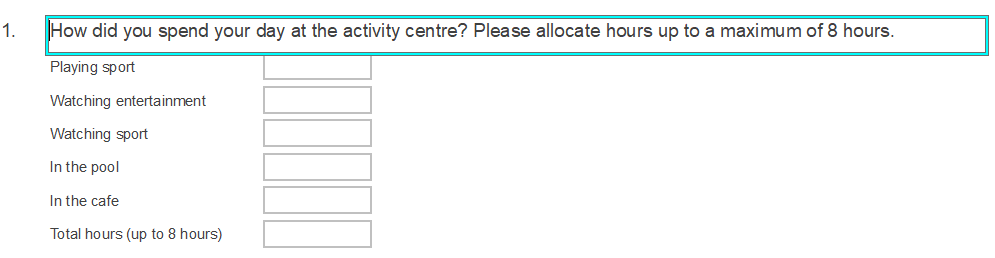
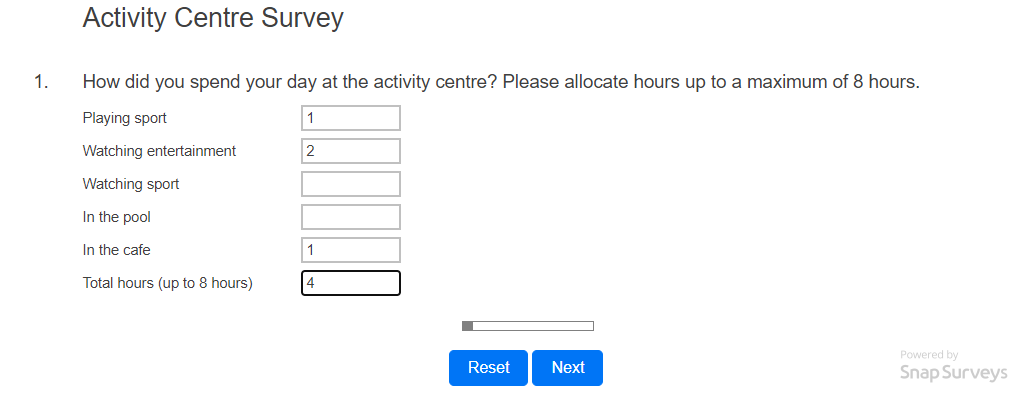
- Enter the question text, for example “How did you spend your day at the activity centre? Please allocate hours to the activities up to a maximum of 8 hours.”
- Enter the first activity in the grid label.
- Press Tab to create the next question in the list. By default, the next question added is an Open Series Next question with a Quantity response. Enter another activity in the grid label. Repeat until you have entered all the activities.
- Add an extra grid question to display the running total.
-
Click Save
 to save the questionnaire.
Step 2: Display the total in the calculated field and set the valid range
- Select the open series question that will display the total.
-
Click Variable Properties
 to open the Variable Properties dialog.
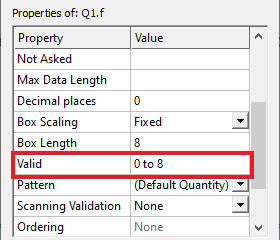
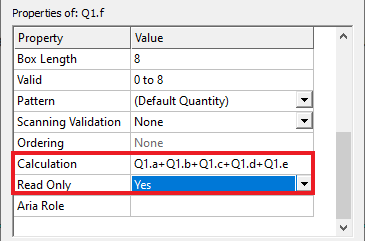
- In this example, the total hours have a valid range of 0 to 8. Scroll to the Valid property and enter 0 to 8.
- Scroll to the Initial Value property and enter the total: Q1a+Q1b+Q1c+Q1d+Q1e. When the open series entries change the value of the total field is updated when the respondent moves to the next entry. The questions used in the total calculation must always be asked earlier in the questionnaire.
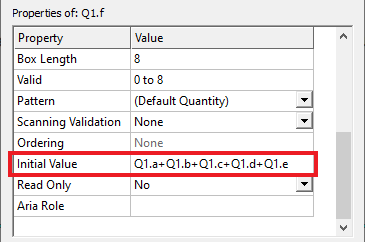
- By default, the Read Only property is set to No. This allows the respondent to edit the total field. In this example, the total should not be edited so set the Read Only property to Yes. This renames the Initial Value property to the Calculation property.
- Click OK.
-
Click Save
 to save the questionnaire.
- When the questionnaire is complete. Publish the survey in Snap XMP Desktop or Snap XMP Online.
If there is a topic you would like a worksheet on, email to snapideas@snapsurveys.com