Creating a cross-tabulation
An analysis table can be created to analyse one question against a number of other questions, producing cross-tabulations. Tabulations of up to five million cells are possible, with a maximum of either 2,000 rows or 2,000 columns. Each table can be made up of a number of variables, and, using commands such as WITH and PER, you can generate complex tables.
This example uses the Crocodile Rock Cafe survey supplied with Snap XMP Desktop.
-
Click
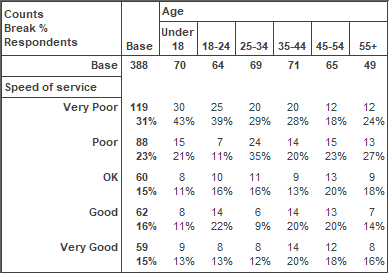
 to display the Analysis Definition dialog box and type into the Analysis field Q6a. Type Q9 into the Break field.
- Check Break Percents, which shows each answer as a percentage of the column totals for the break variable (Q9).
- Press OK and a Cross-tabulation will be built, showing the values of Q6a as the row labels on the left-hand side of the table and the values of Q9 as the column labels across the top of the table.
-
To add more variables to the table, click
 to display the Analysis Definition dialog box, and use the word WITH to link the variables together. For example, Q9 WITH Q10. As an alternative to WITH use the : character.
-
Click
 to save the table. The name will be generated by Snap. If you then wish to work on the table again, it is stored in the Analyses Window
 .
.