Chart elements
Each chart is contains a number of elements.
- The Title is an area to display the name used to identify the chart. The title is composed of the variable labels for the variables on the chart. This can be replaced with user defined text.
- The Plot is the area of the chart that displays the data.
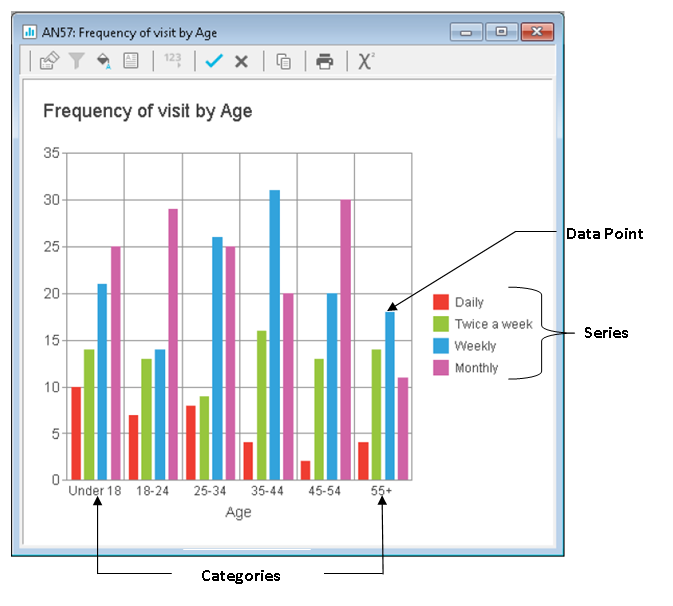
- A Data point refers to a value or a single piece of data on the chart.
- Series are sets of related data. In Snap these are the codes for the analysis variables.
- Categories are used to group a series. In Snap these are the codes for the break variables.
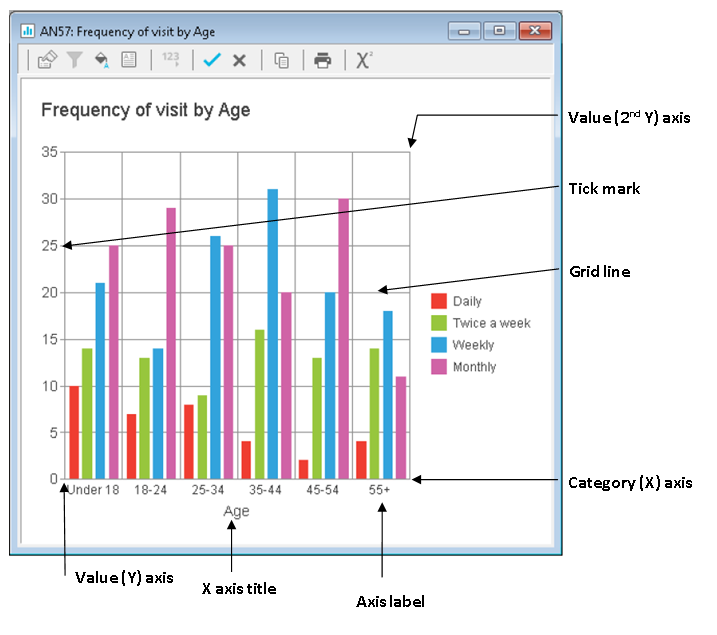
- Grid Lines can be incorporated into the charts to provide a measurable scale through the chart.
- Legends provide a key to the data in the chart. These are by default placed on the right of the chart.
- The Y axis is the vertical axis on most charts. In horizontal charts the x and y axis are interchanged. The y axis usually represents the values such as counts or percentages.
- The X axis is the horizontal axis on most charts. The x axis usually displays the Categories.
- The Z axis is used in 3 dimensional charts. The z axis usually displays the Series which are described in the Legend.
- Axis labels are words or numbers that mark the different sections of the axis.
- Axis title is the name given to describe the entire axis.
- Tick marks are short lines that mark an axis into lengths of equal size.
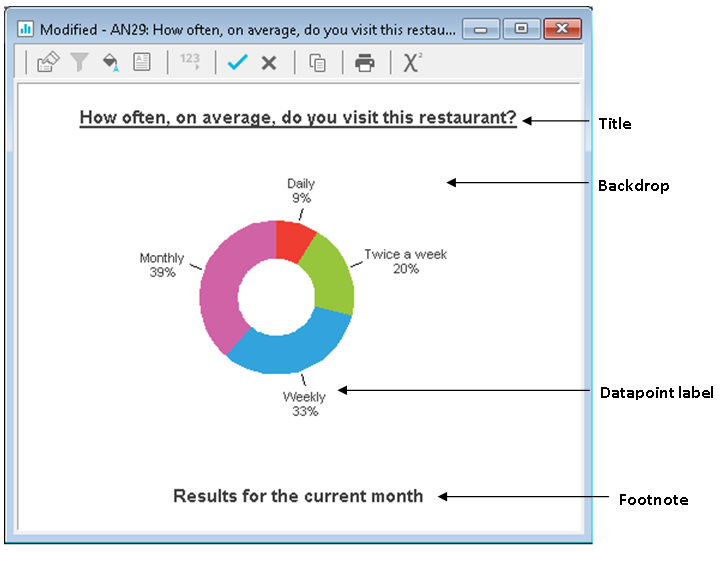
- Data point labels can be attached to each individual Data point and there are options for adding the code name, the code value and the percentage.
- Backdrop is the background area of the chart that can show an image or background color.
- The Footnote is another area of text that can provide information about the chart.