Categorising literal responses
- Click
 to display the Variables window.
 - Select the variable which will act as a source to the derived variable. Double click the variable or click
 to open the Variable Details dialog.
 - Click
 to display the Pattern drop-down. If it is not already selected choose lower case as the pattern.
 - Save the variable and return to the Variables window.
- Click
 to add a new variable.
 - Specify the Variable Details:
- Name: V1
- Label: Comments
- Type: Derived (the variable will derive its data from existing variables).
- Response: Multiple (each respondent could fall into more than one of the new codes if they made more than one comment).
- Specify the Code Details:
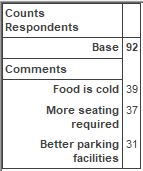
Code | Code Label | Value |
1 | Food is cold | Q9=”food” and Q9=”cold” |
2 | More seating required | Q9=”seat” |
3 | Better parking facilities | Q9=”park” |
-
Click
 to save the variable. The variable can then be used in tables and charts in the usual way.
Snap is case sensitive so an appropriate pattern must be applied to the source variable to ensure that all cases with relevant comments are captured.
Categorising postcodes
The best way of analysing postcodes is to create a Derived Single Response variable and to apply a pattern to the variable.
The following instructions show how to categorise the postcodes by area.
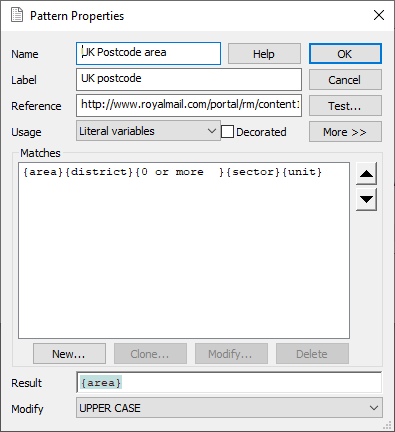
- Select Tailor | Patterns to open the Patterns dialog.
- Select postcode uk from the list and click Clone.
- Give the pattern a new name, such as UK Postcode area.
- Clear the Result box if required. Hover over the Result box and right click.
- Highlight Component and a list will appear containing the components of the pattern.
- Choose area. This will now appear in the Result box.
- Click OK to return to the Patterns dialog
- This pattern will be used as part of an ‘as’ expression in the derived variable.
- From the Variables Window click
 to add a new variable.
 - Specify the Variable Details:
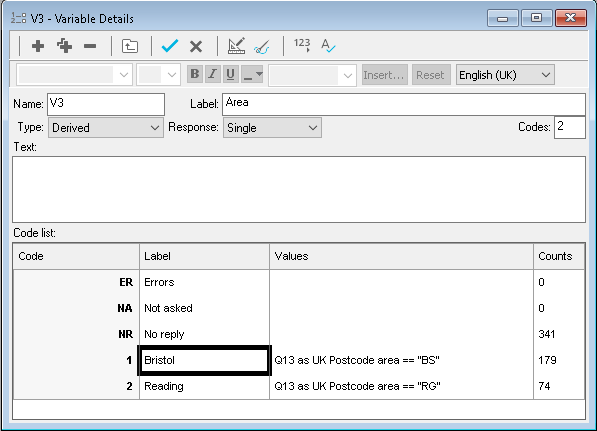
- Name: V3
- Label: Area
- Type: Derived
- Response: Single (each respondent will only fall into one of the new codes)
- Specify the Code Details:
Code | Code Label | Value |
1 | Bristol | Q11 as UK postcode area ==”BS” |
2 | Reading | Q11 as UK postcode area ==”RG” |
-
Click
 to save the variable. The variable can then be used in tables and charts in the usual way.
If you wish to check your results you may do so by using the filter
![]() button in the Data Entry window. Using the example above, you could enter a filter value of V3=1 to ensure you have specified the value correctly for the ‘Bristol’ area.
button in the Data Entry window. Using the example above, you could enter a filter value of V3=1 to ensure you have specified the value correctly for the ‘Bristol’ area.